SANDUSD ❕ near the trend lineTrading volumes have increased.
The price is near the trend line.
I believe the asset may rise after fixing above the upper boundary of the range.
SANDUSDT trade ideas

SAND/USDT - Bearish Gartley Pattern - HarmonicsSAND/USDT is currently forming a bearish Gartley Pattern. Expecting price to move to Point D or Potential Reversal Zone. Will look for Divergence at Point D and short using Dow Theory!

✅TS ❕ SANDUSD: low volatility✅✅ SAND/USDT holds the uptrend line.
Volatility has declined.
We expect a rebound. ✅
🚀 BUY scenario: long to the resistance area. 🚀
----------------------------------------------------------------------------
Remember, there is no place for luck in trading - only strategy!
Thanks for the likes and comments

Sand idea 19/03/23Idea is to Long a breakout or retest of demand zone targeting prior 3d supply zone.
Thesis is Gaming event next week so all gaming related coins should go up & altcoins have a lot to catchup to BTC.
Confluence:
1) If it can flip the supply zone that led to 26% nuke on h4
2) HTF its bullish
3) h4 bullish MS

SANDUSDT on weekly support, long favorable towards weekly resistThe price has hit the weekly support and trading currently just above it. Since the price is around support, a long is favorable here.

#SANDUSDT #LQR #TOBTC #LaqiraProtocol The price below the downtrend is correction
If Break and confirmation, you can open a trade up to the specified resistances
In the specified support and resistance, you can open a trade if it is approved
The interfills have been obtained from the confluence of fibo and static surfaces
This analysis is not an offer to buy or sell

SANDUSD Daily: 25/03/2023: First long then short!!!
You can see all the details on the chart.
Please pay attention, we need low-timeframe confirmation.
It's not investment advice, so do your own research!!!
If you have questions, feel free to ask!
💡Wait for the update!
🗓️25/03/2023
🔎 DYOR
💌It is my honor to share your comments with me💌

Crunching the Numbers!Sandbox is currently trading at 0.65, which is down by 6.29% in the past 24 hours. The good news is that the coin seems to be finding some support at the 0.5 Fibonacci level in the 4-hour timeframe. This could be a sign that the price won't drop much further in the short term. However, there is some resistance to watch out for at the upper Bollinger band of 0.71.
The Relative Strength Index (RSI) for SAND is currently at 47.5. This suggests that the coin is not oversold or overbought at the moment. However, the stochastic oscillators are at 28.5, which does suggest that the coin is currently oversold.
Looking at the MACD, which measures the momentum of the coin, it's currently at 0.0033. This is a bullish signal that suggests that the coin could see a potential uptrend in the near future.
The hourly Exponential Moving Average (EMA) 50 for SAND is at 0.64, meaning the coin is currently trading below its moving average. This could indicate a bearish trend for the currency. However, the On-Balance-Volume (OBV) is currently at 6B, suggesting that trading volume has increased over the past few hours. This could be a bullish signal for the coin.
The trading volume for SAND has decreased by 13.2% recently, which is something to keep an eye on. The 24-hour high for the coin is at 0.6882, while the 24-hour low is at 0.6251. This indicates that the coin has been quite volatile over the past day.
Overall, it seems that SAND is in a bit of a bearish trend right now. However, there are some positive indicators to keep in mind, such as the MACD and OBV. It's important to keep a close eye on the resistance levels and the trading volume to get a sense of where the coin is headed next.

SANDBy stabilizing the high price of the daily resistance and by forming a triangle pattern, this position can have a good profit in the long direction

🔥 SAND Bullish Channel: Waiting For BounceSAND has been trading inside a bullish channel for the last week or so. With SAND showing weakness for a few days now, I wouldn't be surprised if SAND will move back towards the bottom support line.
I'm waiting for this moment. Not sure whether it will actually happen, but if we fall further you can expect the bottom support to be a moment where a lot of buyers will step in.
Target at $0.7

Sandbox Looks Promising for breakout Seems Like Sand will Continue Its bullish Moves
Forming Bullish Flag In H8 Timeframe Incase Of Breakout Expecting Another 45 to 50% bullish Move

SAND ANALYSIS (ROAD MAP) (12H)Hi, dear traders. how are you ? Today we have a viewpoint to BUY/SELL the ICP symbol.
For risk management, please don't forget stop loss and capital management
When we reach the first target, save some profit and then change the stop to entry
Comment if you have any questions
Thank You

SAND, stormy days on the way!Hello, technical forecast for sand
If btc falls, a new bottom may occur, I will keep an eye on it

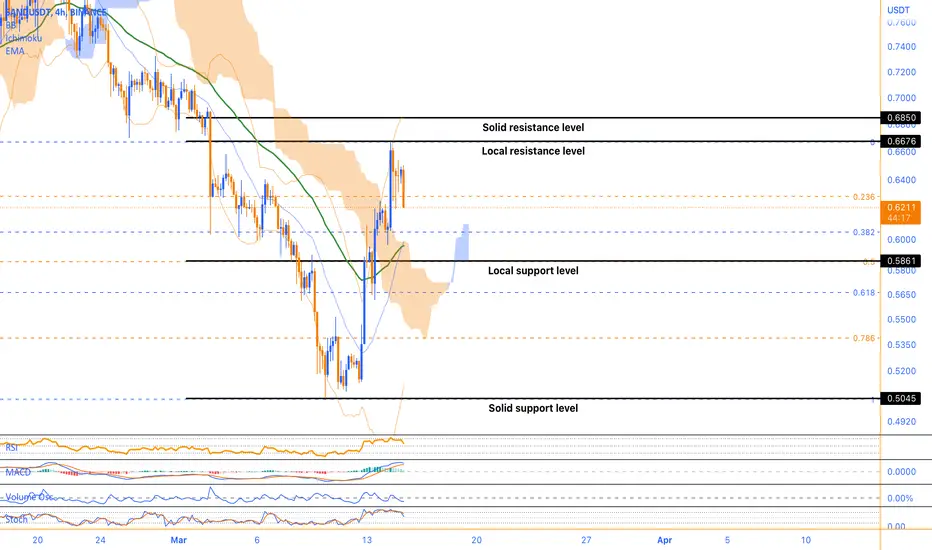
SAND and MetaverseThe Sandbox (SAND) has been gaining significant attention lately, with its current price at $0.6260 and an RSI of 58, indicating that the asset is neither overbought nor oversold. Looking at the 4-hour timeframe, we can see that the price is currently trading below the 0 Fibonacci level of 0.6676 and above the 0.5 Fibonacci level of 0.5861, suggesting that the asset is currently in a consolidation phase.
The upper Bollinger band for the 4-hour timeframe is at 0.6850, while the lower Bollinger band is at 0.5122, and the middle Bollinger band is at 0.5986. This indicates that there is a moderate level of volatility in the price of SAND, but it is still within a relatively tight range.
The volume oscillator for SAND is at -16.65%, suggesting a lack of interest from traders and investors. However, the MACD is at 0.0224, indicating a bullish trend, and the stochastic oscillators are at 58, which is also a positive sign.
Looking at the news surrounding The Sandbox, it appears that the asset is gaining attention due to its role in the growing metaverse space. The metaverse is a virtual world where people can interact with each other in a digital environment. The Sandbox is one of the leading platforms in this space, along with Decentraland (MANA). Recently, both SAND and MANA have been surging in price due to increased interest in the metaverse.
Additionally, HedgeUp (HDUP), a company that specializes in providing blockchain-based solutions for the real estate industry, has also been surging in price. This is likely due to the growing interest in virtual real estate within the metaverse, where companies like HedgeUp can provide value.
In conclusion, The Sandbox (SAND) is currently trading in a consolidation phase, but the bullish indicators suggest that the asset may see a price increase in the near future. The growing interest in the metaverse space, as evidenced by the surging prices of SAND and MANA, suggests that there may be significant potential for growth in this area. Additionally, companies like HedgeUp that specialize in providing blockchain-based solutions for the real estate industry may also see significant growth as virtual real estate becomes more valuable within the metaverse.
SANDBOX ⌛🦜 Needs to Break the 70c 🏴☠️☠SANDBOX is my preferred Metaverse crypto project and it is time for an update.
As always SANDBOX has 'something new cooking' :
Sandbox is Launching Limited-Edition Gordon Ramsay Web3 Avatars on March 15th
The 2,333 avatars are expected to come in two waves and will grant exclusive access to “exclusive experiences” on the platform. The partnership between the Sandbox and ITV’s Hell’s Kitchen was initially revealed in August 2022.
Now off to the chart:
0,70 breakout would clear the way for a rise to 1.36 target, where the next resistance lies.
0.59 is support we might need to retest but not necessarily.
Overall, great project and always looking for Long positions here as I see potential for 5-12$ in the next run.
one Love,
the FXPROFESSOR

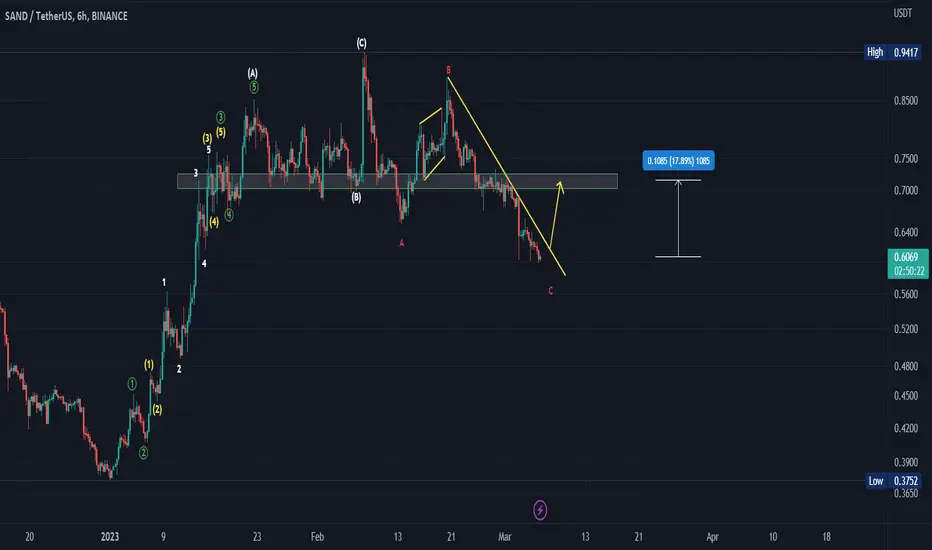
What after the triple drop?A triple decline has been made and we are at the bottom or near the bottom of the descending C wave. After the current completion, a corrective rise is expected for the shaded area.. So let us see what will happen?
Sand broke the recent uptrend to the downside. SHORTSand performed poorly in its last bullish cycle. It hardly even reached the ema200 level compared to most altcoins. Therefore, its weak outlook has weakened further with the breaking of the latest uptrend.
If I were a metaverse investor, I would use my preference for mana these days. However, the sand will also bring him down.
Ideal for a short plan when the market pulls back.

quick short till Please have a look at this analysis, make sure to leave a comment, thank you.
.60
.59
.58
.57
.56
are my targets.


Cheap price to buy the SANDThe stock, after a year of correction, broke through the downward resistance line and consolidated above it.
At the moment it has been in a sideways position for a month already. And at the fall to the area of ~0.68$ the asset is actively bought off.
Buying at this time looks very profitable.
All targets are on the chart.
This is not a financial advice, everything you do is at your own risk

SAND LONGHello again.
I'm looking to go long on SAND at a level that I think might se a support, High leverage weekly scalp, I'll risk 3% of my account on this for a 1:1 target @ 30x. I want to be in and out in less than 10 days no messing about. I'm interested in making a good trade more than I'm interested in getting rich quick, this is a hobby and an art form, not the answer to financial problems. I'm just reminding myself as well as everyone else.
Cheers
Shaun

SAND shortSAND broke trough the ascending trendline. Asset broke trough the support level. Bearish movement to support level at 0.491 is possible.

Sand buying areaSand is at support...I have drawn 2 buying area for sand, those green horizontal lines are the buying area for sand.
