SANDUSDT trade ideas

SANDUSDTPERP - Are Your ready to be live in dust ?Let's deep dive to the SANDS of time....
With the BTC in danger of fall, SAND will be in the line to get heavy hit.
Not Investment Advice..

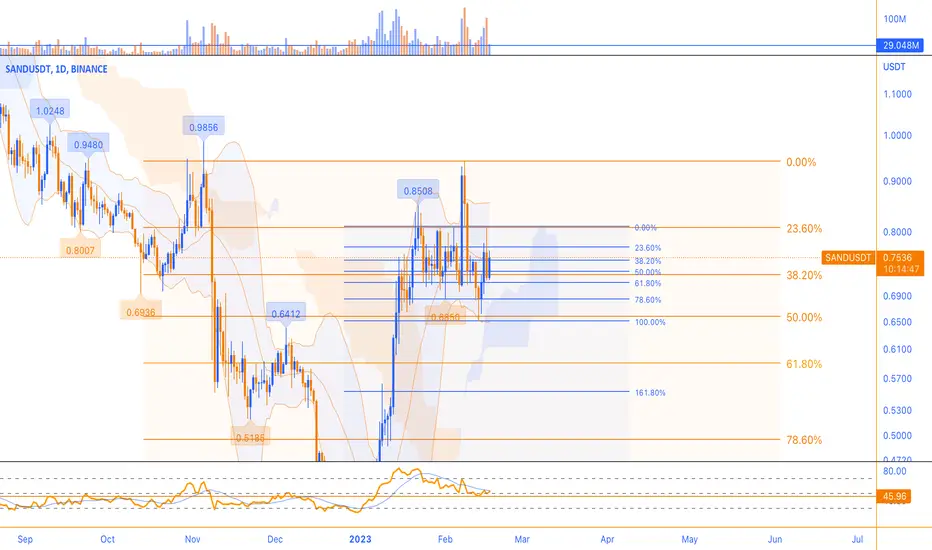
SANDUSDT is testing the key level!Currently, the price of SANDUSDT is testing the 0.786 Fibonacci level as resistance and has experienced its first rejection from the $0.9 resistance level.
The 0.786 Fibonacci level is a commonly used level in technical analysis and is considered a significant level of resistance.
In the case of SANDUSDT, the 0.786 Fibonacci level is acting as a significant level of resistance, as the price has been unable to break above this level. Additionally, the $0.9 resistance level is also acting as a strong resistance level, with the price being rejected at this level on its first attempt.
In order for the price of SANDUSDT to have a breakout, it must hold the dynamic support level. Dynamic support refers to a level of support that is constantly moving as the price of the asset changes. Traders often use moving averages or other technical indicators to identify dynamic support levels.
If the price of SANDUSDT is able to hold the dynamic support level and experience a breakout above the 0.786 Fibonacci level and the $0.9 resistance level, this would be a signal to apply Plancton's Rules and consider taking a new long position. As mentioned earlier, Plancton's Rules are a set of technical analysis rules that can help traders to identify potential trading opportunities.
The bigger picture is an important concept in trading because it refers to the broader trends and patterns that exist beyond the short-term movements of an asset's price. Understanding the bigger picture can help traders to make more informed decisions and to develop more effective trading strategies.
One of the key benefits of considering the bigger picture is that it can help traders to avoid getting caught up in short-term fluctuations that may not be reflective of the underlying trend. By looking at longer-term charts and trends, traders can identify patterns and support and resistance levels that can provide more reliable signals.
–––––
Follow the Shrimp 🦐
Keep in mind.
🟣 Purple structure -> Monthly structure.
🔴 Red structure -> Weekly structure.
🔵 Blue structure -> Daily structure.
🟡 Yellow structure -> 4h structure.
⚫️ Black structure -> <= 1h structure.
Follow the Shrimp 🦐

I think the sand will repeat its rise to at least $ 7 -> X10I think the sand will repeat its rise to at least $ 7, this is X10 from today's level

SAND/USDT | Seems like Ready for Massive Bullish Rally..!!
#SAND Looks Promising for Descending Channel Breakout in 1D TF..!!
Expecting +300% Bullish Rally in the Midterm.. 📈
It's important to maintain a Disciplined and Patient approach to investing in order to achieve Long term Success.
Please like the idea for Support & Subscribe for More ideas like this and share your ideas and charts in Comments Section..!!
Thanks for Your Love & Support..!!

Sand If Reaction To Blue Demand ZoneSand If Reaction To Blue Demand Zone If Breakout Resistance Dynamic And Raise To Orange Zone

SANSUSDT💰 #SAND/USDT has approached to the resistance cluster of neckline of Inverse Head & Shoulders + descending resistance🧐
Bullish case if we do manage to break through the one📈


SandBox ($SAND) : Bullish Pattern development in long term?Hello everyone!
If we look at $SAND in a medium-long term, we cannot rule out a big picture as shown on weekly chart. The big signal of Price Action will be the Neckline achievement (shown on chart as wave IV retest) of a large "Head & Shoulders". Working on daily time frame, I found some interesting resistance levels, useful for evaluating the strength of the trend, step by step.
I came up with this idea thanks to our last trade on Sandbox, which developed a potential bullish impulse structure.
(Click and Play on Chart below)
If there are conditions, I will update this idea below.
...trade with care! 👍
Cheers!
If you think that my analysis is useful, please...
"Like, Share and Comment" ...thank you! 💖

SANDUSD ❕ above the liquiditySAND trades above liquidity.
Price has fixed above 200EMA (4H TF)
The growth of the asset will continue after the resistance is overcome.

SAND had a strong bullish trend over the past weekSAND had a strong bullish trend over the past week, holding the support of the $0.70 range, creating a strong bullish wave on the daily timeframe.
The break of the previous ceiling has been confirmed, but there has been a strong reaction as the price has hit the resistance identified in the $0.90 range. One of the important resistance levels of the sandbox is in the range of $1 rand, which is the target of buyers.
Sandbox has had a range trend over the past week. The price fluctuates between the considered resistance support levels.
The support range of this currency is at the price of 0.610 to 0.670 dollars and its resistance is at the level of 0.880 to 0.900 dollars. Above this resistance, there is a very strong level in the $1 range, breaking these levels requires special support from buyers. Given the selling pressure created in the market yesterday, we expect the Sandbox corrective trend to deepen more likely, and by breaking the current support, the decline could continue to the $0.550 range.
But in the bullish scenario, if minor support is maintained in the range of $0.700 to $0.685, and in the 4-hour timeframe, we can expect another positive swing.
The important point for the medium and long term is the strong bullish wave started at the $0.40 range, if the supports hold, there is the potential for the sandbox to break the $1 resistance, to the $1.25 level. to continue
SANDUSDT Int Daily S/R| Psfp| .618 Fibonacci| Price Action Evening Traders,
Today’s analysis – SANDUSDT- trading towards a key resistance area where a rejection is plausible,
Points to consider,
- Price action impulsive
- Int-Daily S/R Resistance
- .618 Fibonacci Resistance
- Deviation
SANUSDT’s immediate price actin is trading towards a key region where there is resistance confluence with the int-Daily S/R and the .618 Fibonacci, this allows for a bearish bias.
Price action trading around the resistance will increase the probability of a potential deviation.
Overall, in my opinion, SANDUSDT is a valid short with defined risk, price action is to be used upon discretion/ management.
Hope this analysis helps,
Thank you for following my work
And remember,
“Trade the market in front of you, not the one you want!” – Scott Redler

SAND TO HIT $1$SAND was below 200 daily MA since April, 2022!
This daily breakout candle is a strong buy signal indicator. Retest looks clean.

SandUsdt Rdy for ExplodeSand rdy for Explode and going to high and high
i dont have say more but Fundamental good news ad can big pump
rdy for that
GL
EntryPoint:
0.7250 For rush entrypoint but not my advice
0.6514
0.5808
Supports:
0.5183
0.4408
0.3584
Resistances:
0.7496 ( now sand battle with this )
0.8090
0.9252
Targets:
1.0306
1.1490
1.3410
1.6331
2.0986
2.3923
2.8840
MidTime:
4.0991
5.2675
HODL:
7.2392
10.2890
GL
MidTime:

SANDUSD Bullish BAMMWe have alot of shorts popping up on SAND as the BTC price action remains sideways we also have Hidden Bullish Divergence and this is all happening at Session Levels; If this goes as expected we can see it move up about 10%

sandI think the downward trend line will be broken and the rise of the market is not far from expected, it is not a buy or sell signal and it is just a personal opinion

SAND/USDT reviewAs in the majority of tickers on market, price after consolidation has updated local maximum and started to make corrective downward movement.
There is a possibility of the soon ending of the fall and continuation growth cycle. Otherwise, is is possible that corrective structure drags on.

THE SANDBOX Price Analysis TO THE MOOOON!!??$$$ DAILY CHART $$$Here are some key LVLS of support and resistance for the sandbox token :)
After this nice PUMP to the upside.. Will SAND keep the momentum!>>>????
LET ME KNOW WHAT YOU GUYS THINK :)
BINANCE:SANDUSDT

Like Sand in the hour glass...If you find this info inspiring/helpful, please consider a boost and follow! Any questions or comments, please leave a comment! Also, check out the links in my signature to get to know me better!
From an Elliott Wave stand point I would be looking for at least a sweep of the low. My main focus is on these levels that seem to be reactive atm.
I will be keeping an eye on these levels for plays.
Cheers!

SAND Going DownThe tool is in the descending trend. The cascade of local minimums has been formed, which have gathered a lot of liquidity. Trading volumes have fallen, which is clearly visible on the graphics. They can’t buy it higher what speaks of the seller’s weakness. Now the instrument is consolidated in the proximity of the level, which also confirms the short scenario also confirms the short scenario . I am looking for a scrap, and the impulse exit to the shorts.
The goal is updating the local minimum.

SANDUSDT | PARALLEL CHANNELSAND has been trading in bearish parallel channel .
The price is printing lower lows and lower highs
The price is currently trading near the upper boundary of channel.
It is trading at an important zone.
The bears will get control below the support zone .
Manage your levels accordingly.

SANDUSD ❕ ready to riseThe correction took place on declining trading volumes.
SAND is trading in a channel above the support area.
I expect the price growth.

