SANDUSDT trade ideas

SAND Short IntraHTF Pull back Bias
Confluences:
15m Bos
Possible H&S Pattern
Pivot line as Entry Price
Target Profit:
0.5 supremacy

SAND / USDT Trading Idea Hello, traders
The trend is bullish and the momentum is still there, so we expect the bullish trend to continue

SAND S&R IN SHORT TERM>>>>>Hello EveryOne
I Have Tried My Best to Bring the best Possible outcome in this Chart.
SAND moving in long term downtrend channal,But in short term can continues rising price,
In case of more supported market
sand can hit to 0.80-0.95usdt price.
short term support & resistance's are in 0.65-0.75usdt,
dou to the more support market We can set buy position in daily correction.
Market can be so tuff if we don't careful.
It's just an analyze,
Not a financial advise.
PLZ DYOR
With hopping success>>>>>>>>>


We can expect a stronger positive reactionSAND's price, which had a negative reaction in the resistance range of $0.805, pulled back to its support in the range of $0.657 to $0.750. If this area has a positive reaction, SAND can grow to the targets of the $1 range this week or next. The strength of the bullish wave is enough to change the trend in the daily time frame. But a bottom pivot and the formation of a corrective wave are needed, which with more probability, we can expect a stronger positive reaction in the second support range, i.e., the price of $0.584 to $0.641. So, if the support area of $0.67 is broken, the decline can continue to the level of $0.584, and in this area, we can expect the formation of reversal patterns.

SAND/USDT. BitVero Crypto Academy.
Disclamer:
We are not financial advisors. The content that we share on this website are for educational purposes and are our own personal opinions.

SandThese are his resistances for a month ago, when we said he would reach them, and they have just reached them
Now we have a green box in 5 minutes as support and one hour time for those lines
For ease of work, we drew a channel in 15 minutes, which will probably go to the midline of the channel, and then we will see if it goes to attack the roof again or not.


SAND (Y23.P1.E1).The big picture and short term plans\setupsHi Traders,
If your familiar with the Stan Weinstein approach or just know the significance of the 200 daily ema. well we are close to it and its likely a good reversal position and likely a micro wave 5 position.
The push back might be a little or also I will be looking for a shorting structure in the smaller time to enter.
All the best,
S.SAri

SAND : INCREASE TRENDSAND showing on low time frame interesting view for increase.
The sand coin is known also by hold high whale wallets.
SANDUSDT Potential Reversal Waiting for a Reversal in SAND/USDT chart. Here is why,
There are both fundamental and technical reasons.
Fundamental reasons,
12.4% of tokens were unlocked on 14 FebruaryFrom my point of view, this is the main reason. normally Anyone can tell there can be a 10-13% price devaluation at that time. But I'm hoping there can be more than price drop. 🔎 (Token Unlock - Google it )
* Another thing is that I have difficulty identifying the bitcoin movement. That’s why I marked two accumulating periods.
Technical reasons.
We can see two resistance areas on the chart. The chart has failed to break these levels only a few times.Keep an eye on these resistance areas .If there is more than >300M volume. The resistance can break easily. Personally, I would not enter into any trades at that time. Because my whole structure was wrong.
In cases where there was low volume and a high RSI value + a down tread. I consider entering a short position. Thanks . #NFA #DYOR


Buyers' support allowed the price to continue movingSAND continued its strong uptrend over the past week, and buyers' support allowed the price to continue moving without a pullback after breaking through the $0.56-$0.59 resistance range. This 102% growth, which started from the floor area of $0.38, stopped at $0.75. A weekly resistance was considered in the $0.65-$0.74 area, which was broken in the past due to heavy selling pressure.
In the past few days, the price hitting this range has been accompanied by reactions, and in the 4-hour timeframe, we see the formation of a complete range area. More likely, the price can break the bottom of the range channel and enter a deeper corrective wave. The supports that can again create signs of positive reaction, and are considered the range of demand, are at the prices of $0.6423 and the range of $0.5600. But if the current resistance is broken, the next target for buyers after the pullback will be in the range of $1.0742 resistance.

SAND (Y23.P1.Video).The big picture and short term plans\setupsHi Traders,
#SAND #SANDBOX #Crypto
We point out the key levels as usual and give a few scenarios based on fibonacci, MA and conditions to fit the plan.
Please give us a like and share,
Regards,
S.SAri

SANDUSDT | SUPPORT BROKENSANDUSDT has been trading with in a channel.
The price has recently broken below the channel.
Now the price has approaching to the retesting the resistance zone.
Manage your levels accordingly.

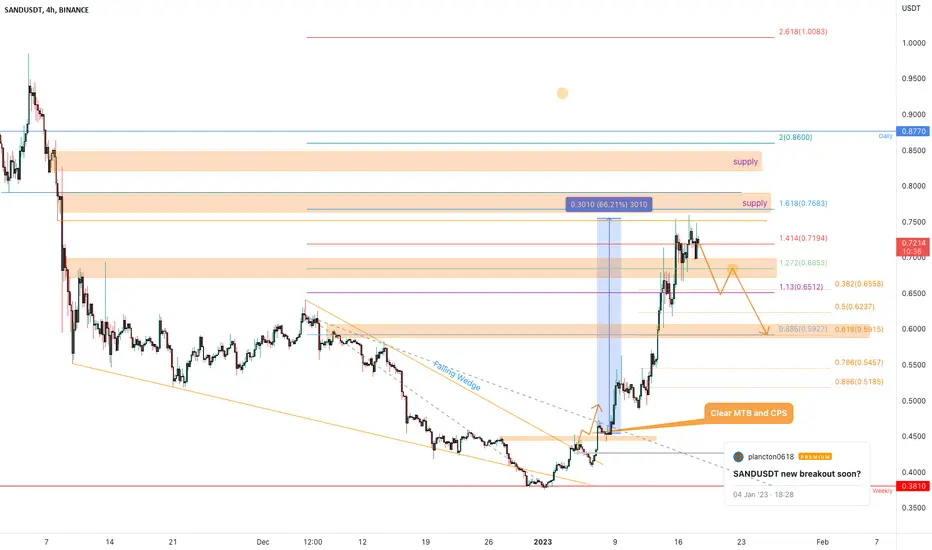
SANDUSDT time to retrace?SAND had a huge breakout as I mentioned in my previous idea () where the price printed a clear 66% after breakout and after satisfying our Plancton's Rules.
Not the price is over extended and it's testing the 1.618 Fibonacci level exactly on the supply zone.
We can see how the price formed a clear falling wedge exactly on the weekly support on 0.38$ area and after the false breakout, the market started with the bullish movement.
What's next?
The price could have a retracement until the 0.618 Fibonacci level (the 0.6$ area) if the price is going to lose the current support (0.7$) area, so According to Plancton's strategy , we can set a nice order
–––––
Keep in mind.
🟣 Purple structure -> Monthly structure.
🔴 Red structure -> Weekly structure.
🔵 Blue structure -> Daily structure.
🟡 Yellow structure -> 4h structure.
⚫️ black structure -> <= 1h structure.
–––––
Follow the Shrimp 🦐
✳️The Sandbox | 1D TF | Jan 16 | #SAND $SANDSAND has just got out of the downtrend since Jul-2022, next target should be 1$
🔮Our forecast about SAND movements in next days :
- Move upward to 1$
♻️Back-up plan: If SAND drops under 0.7$, it would be a bad sign


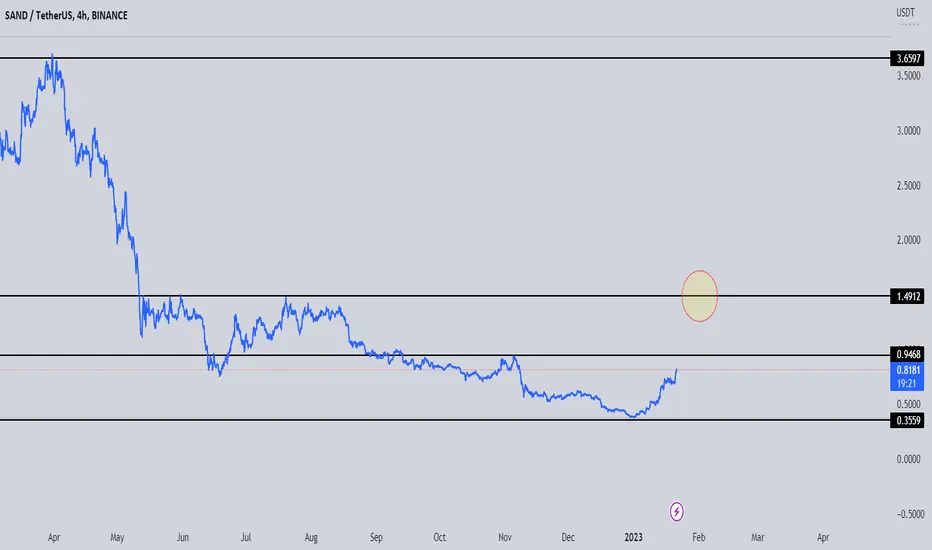
🔥 SAND 15-Month Downtrend Broken!Ever since SAND topped out in November 2021, the token has been selling off very hard, losing over 95% of its value in the process.
However, SAND seemingly has broken out of the perpetual downtrend during Bitcoin's rally of last week.
The move was violent, so we will likely retest the resistance as support. Overall, I'm still looking for a long position.
Targets in blue.

SANDUSDT new breakout soon?the price is testing the static resistance after the breakout from the dynamic one.
Now the market needs to create a new breakout from here
How to approach it?
IF the price is going to have a breakout, According to Plancton's strategy, we can set a nice order
