SAND can move strong!SAND is in a perfect buy period, with a potential to start flying at any moment.
Do your research about the project and make a wise decion.
HAPPY NEW YEAR YOU ALL
THIS IS NOT A TRADING ADVICE, PLEASE INVEST AT YOUR OWN RISK
SANDUSDT trade ideas

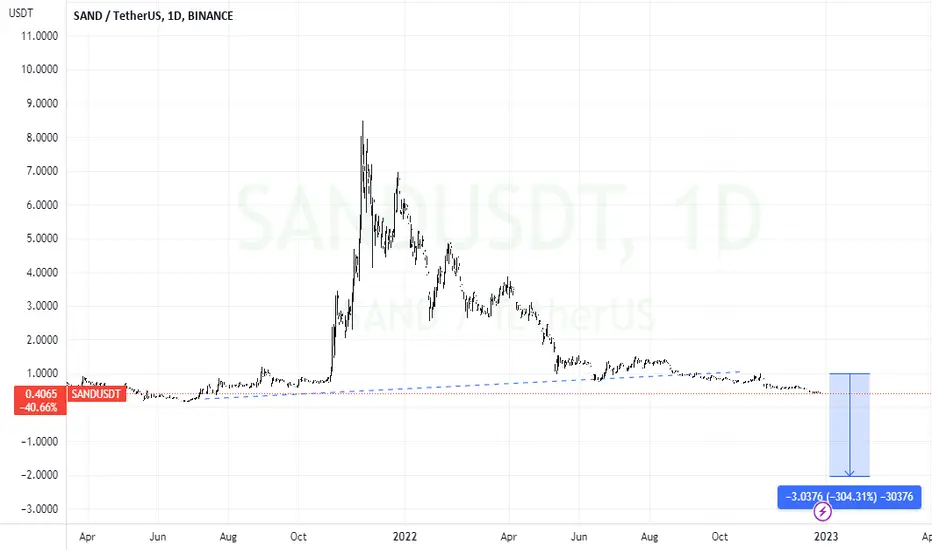
SAND ? Below 1c
Is it possible ?
Was below 3c before this. Characteristic of impending sell off.
My prediction major holders would be selling.
= Softbank : reason >> get cash back. For new venture maybe.
Anyways .
It will be reveal in the news. Prep.
All the best
"SANDUSDT: Rising Wedge, Another Short Opportunity on Altcoins?"Hello Fellow Stock Global Trader/Investor! Here's Technical Outlook on SANDUSDT
Chart Perspective
SANDUSDT has retested the multiple rejection area and formed a rising wedge. The breakout of the rising wedge pattern indicated a possible bearish bias ahead. The MACD Indicator made a death cross signifying a possible downside movement shortly.
All other explanations are presented on the chart.
The roadmap will be invalid after reaching the target/resistance area.
"Disclaimer: The outlook is only for educational purposes, not a recommendation to put a long or short position on the SANDUSDT"

RR=1.83 buy ideaExpecting to see a trend reversal as bearish momentum starts to slow down : bullish crab pattern + RSI divergence.
PS : never ris more than 2% of your capital per trade


SAND The Sandbox Price PredictionIf you haven`t sold SAND here:
Then you should know that Grayscale expressed concerns over the potential impact on the Ethereum Merge, especially on tokens that run natively on Ethereum:
The Merge may lead to a fork that might have unexpected and unfavorable outcomes and a scenario where stablecoins and tokens locked in smart contracts might not be redeemable.
Token and stablecoin holders might panic and start liquidating their holdings.
In this context, price target for SAND The Sandbox is $0.70.
Looking forward to read your opinion about it.

SAND - New low, I will try longHi, I oppened long at 0.50$ because of new low. I think we can have a nice rebound here. Good luck!

The Sandbox (SAND) forming bullish Shark| A good buy opportunityHi friends, hope you are well and welcome to the new trade setup of The Sandbox (SAND) with US Dollar pair.
Previously I shared a long-term trade setup for SAND, which is still in play.
Now on a 4-hr time frame, SAND is completing the final leg of a bullish Shark pattern.
Note: Above idea is for educational purpose only. It is advised to diversify and strictly follow the stop loss, and don't get stuck with trade

SAND forming a Top Head and ShouldersAfter a little uptrend, we saw SAND forming the head-and-shoulders top pattern, and, which makes it good for a SHORT CALL, the Neckline crosses Support, it is a very good sign of a possible dump.
NOTE: DYOR, be cautious to place STOP LOSSes and trade your own personality.

🔥🚀BINANCE INVEST IN NFT: BRIGHT FUTURE FOR SAND AND CO.?🔥 Hi friends! NFT have a great future, Binance is investing in the industry, Binance CEO CZ⚡️ said. CZ made this statement during his AMA. This is a green light for the NFT projects such as SANDBOX.
I will publish the list of NFT altcoins ant the end, but now more details about SAND technical situation.
Now the price consolidate inside the HUGE accumulation area of $0.5-0.6 where the whales buy a lot of coins. Take a loof on volume indicator. 4 huge candle spikes! This is a bullish sign for this altcoin.
📊 THE PRECONDITIONS TO OPEN A LONG ON SANDBOX:
1. breakout and test the trendline as the support
2. huge volume to buy on SAND. I use DOM and Footrpint to see the real whales oders to buy or sell, so this will not be a huge problem
3. bullish BTC
✅ THE 3 TARGETS FOR SANDBOX:
🔥 $0.64 - key level and local high
🔥 $0.69 - important mirror level
🔥 $0.76-0.8 - value area
🚩 I make the list of NFT or related to NFT projects on Binance for you: APE , FLOW , XTZ , SAND , CHZ , THETA , AXS , MANA , CAKE , IMX , SUSHI , STEPN, GALA , TLM , BSW , DAR. Traders, take a more detailed look at these altcoins.
💻Friends, press the "boost"🚀 button, write comments and share with your friends - it will be the best THANK YOU.
P.S. Personally, I open an entry if the price shows it according to my strategy.
Always do your analysis before making a trade.

SAND LONGS SET UPBullish bias on SANDUSD
- adapting to bullish fundamentals in crypto market due to the recent cpi data release and fed pivot
- bull flag market structure form on the 4hr timeframe.
- Price showing rejections at key support on the very high timeframe
Trade safe and enter upon confirmations like a break and retest of market structure

TradetoProspa - #SAND, looking to shortHi traders,
#SAND #crypto #SANDBOX
I give a macro overview and what I think is a good shorting opportunity.
All the best,
S.SAri


SANDUSDT analysis buy signal 12/3/2022we will stick to our yellow BC buying area after formation of III yellow sequence RR :3:1 talking in consideration that the market can take the bearish green target as point of starting bullish sequence

SANDUSD ❕ above the rangeSAND is above liquidity.
Trading volumes are down on the correction.
The RSI chart is in the bullish zone (4H, 1H and 30m TFs)
Price has successfully tested 50EMA as support (1H TF)
I expect SAND to continue rising if it overcomes the resistance level.


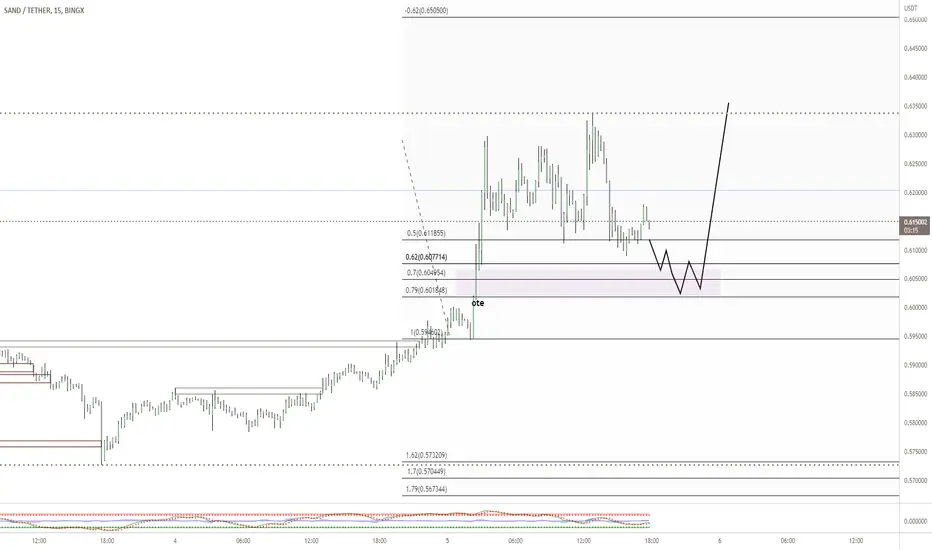
long idea/ict cconceptlooking for price to drop into the .79 retracement level based on fib placement for long move to take out the high
SANDUSDT.P trade idea - 4H Ichimoku levelsHere we trade SANDUSDT using 4H Ichimoku levels/zones.
What do we see?
- price made a higher high
- RSI appears to remain bullish (higher high)
It further looks like we did not yet reach our take profit area. We might therefore expect a higher push, towards zone 1.
For our entry, we identified what looks like a gap in the 4H Ichimku conversion line (Tenkan sen, bleu line). Indicated by the arrows left on the chart. We draw a zone and yes, it looks like we did find support on that level. We enter for a long position with 25% of our budget, 1x leverage. Take profit on zone 1. Stop loss below the next support level underneath our zone.
Remember: this is just an idea, NOT financial advice. Please do NOT take this trade, as it may run into a loss. Only take trades that fit YOUR plan and/or risk tolerance. Happy trading!


#SAND/USDT - Long - Potential 38.75%#SAND/USDT - Long - Potential 38.75%
Strategy: Long
Exchange: Multi-Exchange
Account: Spot
Entry mode: DCA Limit
Invest: 5%
Exit:
Target 3 : 0.8629 46.16%
Target 2 : 0.6915 17.13%
Target 1 : 0.6493 9.98%
DCA Entries
Entry 1: 0.6215 - 25%
Entry 2: 0.5938 - 25%
Entry 3: 0.5731 - 50%
Current market price: 0.621
Stop: 0.535 (-9.38%)
Technical indicators:
24h Volume: 13639844.4034
Satoshis: 0.621
Breakout with volume, BTC at resistance and 200moving average directly overhead so retrace through DCA levels possible. TP1 can be adjusted (brought down) as av. buy price falls.
Trade: SANDUSDT 05/12/2022 09:50
Account: SPOT
Volume last 24h: 13639844.40 USDT

