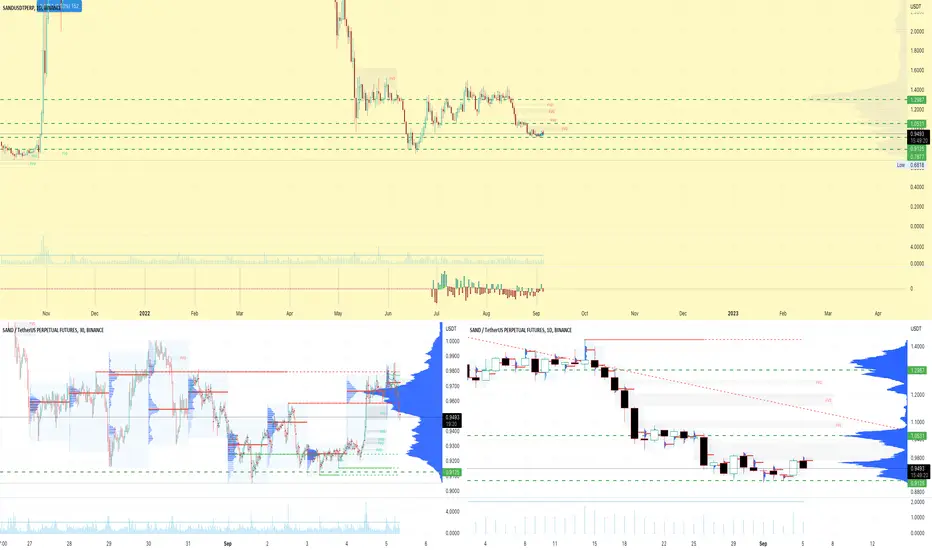
RLinda ! SANDUSDT-> When should we expect a support breakdown? SANDUSDT - Very weak coin on the background of the whole cryptocurrency market. We continue to see the price drop after SAND went below 1,000.
The global chart clearly shows the weakness of the coin, the price is not able to renew price highs on pullbacks with volatility ranging from 40% to 80%. In total, the market is down almost 90% at the moment and we see consolidation near the 0.8700 zone, which suggests a further drop after the breakdown of the level.
I suppose that after the consolidation the fall can continue, I expect that the price can form a pullback to the resistance of the price channel or break the level at once, but in any case you should expect the retest after the breakdown for the price to consolidate under the level. The short-term target is the support at 0.7877, the medium-term target is the liquidity zone at 0.7329.
Regards to R. Linda!
SANDUSDT trade ideas

SAND/USDT is sitting at important levelHey, traders
SAND/USDT is looking interesting don't you think? SAND had an exit from that bearish trend and re-entered that just after 4 days. No it is sitting at upper line of down trend lines and is thinking where to go. We have marked two possible scenarios and all we can do for now is just wait for confirmation so that we can take position as well.
If you like ideas provided by our team you can show us your support by liking and commenting.
Yours Sincerely,
Swallow Team 🔱
Disclamer:
We are not financial advisors. The content that we share on this website are for educational purposes and are our own personal opinions.

SANDUSDT: Growth & Bullish Continuation
Here is our technical view for SANDUSDT.
SANDUSDT is trading within a support cluster .
Based on our view the SANDUSDT will rise to the next structure resistance.
❤️ Please, support our work with like & comment! ❤️

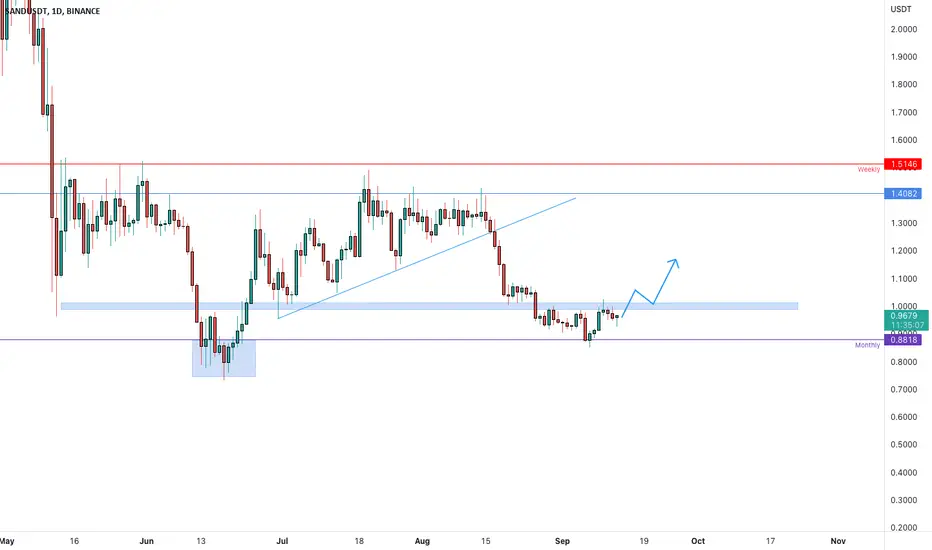
SANDUSDT is testing the resistanceThe price had a breakout from the dynamic support after a retest of the weekly resistance and daily resistance on the 1.4-1.5$ area.The price comes back on the monthly support area on 0.88$ where the previous impulse started
How to approach it?
IF the price is going to have a breakout from the daily resistance (1$) and retest it as new support, According to Plancton's strategy , we can set a nice order
–––––
Keep in mind.
🟣 Purple structure -> Monthly structure.
🔴 Red structure -> Weekly structure.
🔵 Blue structure -> Daily structure.
🟡 Yellow structure -> 4h structure.
–––––
Follow the Shrimp 🦐
SAND/USDTBullish Divergence Spotted on Sand on Stochastic.
We have good confluence with the DXY moving down also.
Entry on 15 minute time frame stop loss below last low.
1:4.6 RR

SANDUSDT LEVELS TO WATCH CURRENTLY.SANDUSDT LEVELS TO WATCH CURRENTLY.
After a nice recovery last month, since sand broke below this blue trendline and confirmed it as a resistance. It has retraced around 35% & now holding support of 0.89 cents.
The nearest resistance is around 1.02 area.
green horizontal lines - Support
red horizontal lines - resistance.

SAND- Lets All Play In The SandboxAnalysis:
- Support & Resistance
- Trend Line
- Supply & Demand
- Fibonacci Retracement
- Order Block Flow
T1: Target 1
T2: Target 2
B: Bottom / End of Correction / Beginning of Bull Run
S: Support
:) Breakout / Bull Run
Opinion:
The correction for Sandbox is over and price will rise the next few weeks/months

Sandbox - Long playWhat I want for a long on Sand - especially given the relative strength were seeing now in the market today.
A retest of demand (grey box) where we broke previous MS and have triggered a micro trend reversal for now would be my entry. This grey box lines up with the break of MS and also the 618 fib level of the recent move off the local bottom (the sweet spot).
Then want to see a strong reaction to punch above resistance from prior bearish consolidation and back INTO the range. If we don't get a strong reaction I will start to debate if this momentum is real or not (what we're seeing on other coins atm).
Tight SL would be set below the low or just below where we broke the market structure.
Or we punch sooner and I don't get filled, have to keep this in mind as well.
V

SANDUSDTSANDUSDT(09.10.2022 UPDATED)
Wait until price touches the trend lines then look for signal bar and key bar /Breakout and pullback to recognize direction of price movement.
Money Management must be obeyed.
Open position without setting the proper stop loss (1% or 2% of total balance ) soon or late will cause to lose all your money ( call margin )
Majority of trades is done via computer trading (forex / cryptocurrency)
priority in analyzing charts:
1- Price Action
2- Market structure
3- Chart patterns
4- Candlestick patterns
5-Divergence
6-Indicators
SETUP IN TRADING RANGE: BLSH
BLSH:BUY LOW SELL HIGH

SAND/USDT Another breakout?Hey guys!!!
Let's talk about another coin at this "Messy" state of the market. SAND has been doing very good with breaking out from resistance zones which are $0.94
and $0.97. For now it is going for another one near $1 zone and securing this zone would mean bullish run towards $1.08.
Coin looks interesting if we would look only at chart but trading at current state of market is risky so know the risks and stay safe!
If you like ideas provided by our team you can show us your support by liking and commenting.
Yours Sincerely,
Swallow Team 🔱
Disclamer:
We are not financial advisors. The content that we share on this website are for educational purposes and are our own personal opinions.

SANDUSDT | BUY ON BREAKOUTSANDUSDT has taking support continuously from rising support. The price has trading near the horizontal resistance. The bulls will take only control above break of resistance zone . While bears will be in control below the resistance zone .
Trade your levels accordingly.

SAND potential to increase +300%#SAND/USDT
$SAND broke out from falling wedge pattern, and have a sideways move between support zone around $0.76 and resistance zone around $1.5.
now price is at support zone which is the same with long-term ascending trend line.
🐮 holding this zone as support will increase price to resistance zone which is the same with descending trend line and breaking out this zone will increase price toward +$3.
👌🏻 so current price has a great R/R to enter.
🐻 break down from support zone will drop price to descending trend line and I think it will take time to survive from this drowning.

#SAND/USDT - Long - Potential 42.38%"Singapore-based bank DBS partners with The Sandbox to create a #metaverse experience."
SAND also in a descending broadening wedge meaning we should be seeing a reversal, this news could trigger the breakout.
#SAND/USDT - Long - Potential 42.38%
Exchanges: Huobi.pro, KuCoin, Bittrex, Binance
Signal Type: Regular (Long)
Entry Targets:
1) 0.973000 - 100.0%
Optional Additional Entries / DCA Points;
2) 0.9509
3) 0.9187
Take-Profit Targets:
1) 1.0031 - 33.334%
2) 1.225 - 33.333%
3) 1.3877 - 33.333%
Stop Targets:
1) 0.844400 - 100.0%
Trailing Configuration:
Take-Profit: Percentage (1.0%)
Stop: Breakeven -
Trigger: Target (1)

SANDUSDT - Descending Broadening Wedge Pattern!SANDUSDT (4h Chart) Technical analysis
SANDUSDT (4h Chart) Currently trading at $0.947
Buy level: Buy after Breakout
Stop loss: Below $0.844
Target 1: $0.985
Target 2: $1
Target 3: $1.2
Target 4: $1.4
Max Leverage 3x
Always keep Stop loss
Follow Our Tradingview Account for More Technical Analysis Updates, | Like, Share and Comment Your thoughts

SANDUSDT DEEP CRABCrab
The Crab Pattern is a volatile 5-point extension structure that was discovered by Scott Carney in 2000. It has specific Fibonacci measurements for each point within its structure and it is important to note that D is not a point, but rather a zone in which price is likely to reverse, called the Potential Reversal Zone (PRZ). The B point retracement of the primary XA leg lies between 0.382 and 0.618 and the PRZ consists of 3 converging harmonic levels: 1) 1.618 extension of the primary XA leg, 2) AB=CD pattern, either equivalent, 1.27 or 1.618 and 3) Extreme BC projection of 2.24, 2.618, 3.14 or 3.618.
The first target would be the 382 retracement of AD and the second target the 618 retracement of AD. Common stop levels lie behind the next structure level after the D point or the 2.0 extension of XA. Conservative traders may look for additional confirmation. These patterns can be bearish and bullish. TradingView has a smart XABCD Pattern drawing tool to visually identify 5-point reversal structures on a chart.

SANDBOX- Updated LevelsSandbox is a project we like to Buy but always in good time and the timing ain't good at this stage.
Here is the charts with my 3 entry levels I'm looking at next.
0.59 is a strong support as much as 1.43 ended up being a strong rejection/resistance.
Patience Snoop and remember: smoking weed kills your brain cells, pass more than you puff.
One Love but no puff here yet,
the FXPROFESSOR

SANDSUDTIf the price breaks below its channel at the price 0.8567 before 08 September 2022 , the price will be in momentum and expect the price to reach 0.7967.
If it breaks below its channel, place a short position or sell order at 0.8445, take profit at 0.7970 and stop loss level at 0.8971.

SAND - time to fill liquidity gapslooking at these gaps on the 4h, and looking to take an even amount of profit off of each level, then throw stop loss to break even after the first 2.

SAND/USDT 1HOUR SETUP 💰Hello Guys 🎲
Price needs to collect liquidity from low levels to reject pivots.
Or if it stabilizes above the 2 pivot lines, the price will go up to the red resistance.
Arztoday Team ✨

SAND in cooking something 😋SAND is cooking something on Trendline can it give unbelievable breakout ?
Catch it OR watch it 🤗

SANDUSDT ANALYSIS#SANDUSDT Update
SAND is forming a small downtrend channel on the 4h chart, The resistance is $0.96-$1.00 and a break above $1.00 will start a new rally. The local support is $0.90 area and the next support is $0.80-$0.82 area. Wait for a break of the downtrend channel for new trades.

SANDUSD ❕ downward channelSAND has fallen below liquidity.
Price and RSI have formed a bearish divergence (1H TF)
The asset is testing the upper boundary of the descending channel.
I think price will be able to go lower if it holds inside the channel.

SAND is ready for breakoutHey, SAND is looking ready for a breakout - currently in pullback, entering with low leverage, taking profit around trouble areas... what do u think?