LOOKING FOR A BUY STEP ON SANDBOX ...!Sand looks bearish for short now, due to the probable bearish signals on btc. Despite the growth of the market is expected. In this case, we must look for appropriate reversal levels for entry before the bullrun !
Stay tuned for more post and my updates... >_-
SANDUSDT trade ideas

SAND3SUSDT BEST BUY SETUPSOn a long term, we are looking to see a 300% move. However, we are in a resistance zone and we are looking to see either a breakout or reversal from the supply zone.

$SAND -1D Chart (Short)This is my first published chart so don't beat me up too bad.
Over 372 Million tokens have been unlocked to VC investors who are up 300-350X entry price.
Unlocks are typically bearish & I don't believe this will be any different.
However, the support seems strong at $.68-.88... so those are my targets.
This is not financial advice. Just my idea on where I believe $SAND is headed.

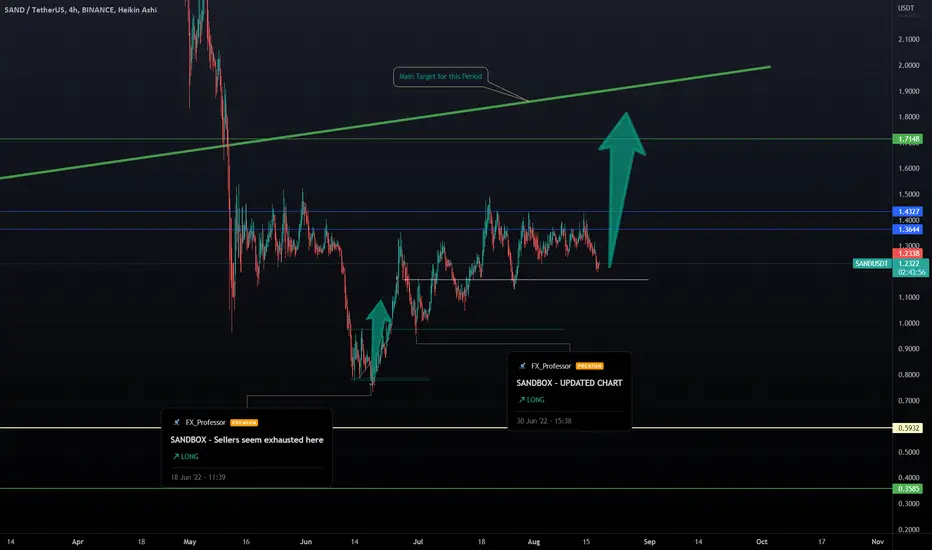
SANDBOX- The Right Side of the MetaverseI say the The Right Side of the Metaverse because it's a fun place to create and I like what they do. I have posted about Sandbox and it's qualities many times.
Message for you:
Professor here and time for announcements:
I have decided to take it easier with charts for the next period and focus on education.
In my time here at Tradingview I have met a lot of (mostly) nice people striving to 'find out' what will happen next and how they can trade and make money.
💭 Allow me to say that the vast majority (90%+) fail to do anything good with the information they receive here:
- People don't realize that analysis (either Technical or any other kind ) and predicting 'what will happen next' is just not enough. Ever.
- I would say that Prognosis (right word for what you think is Analysis) is less than 20% of the success
- People don't know How to trade . (So why even look at charts? It won't help you much)
- Even traders with experience and knowledge..it's what they want them to know thus they struggle too
- The understanding of Trading that the average Trader gets from what's online is just WRONG
- Not knowing is fine. 'Knowing'' something that is fundamentally wrong is Bad news (exactly the case with some here)
- People do not know how to MANAGE their positions. That's number 1 issue
- They (and probably YOU) don't know how to manage yourselves, your emotions, your budgets or the market. That's the main issue.
👉 So why keep posting charts so often when the problem is something different?
There are TONS of material out there but I have seen nothing that meets my criteria and can actually help new traders in a simple, understandable, structured way that can work.
💡 So i decided to take some time off and create exactly that:
An easy to understand Method that works for beginners. Look for it in September.
I will be Back,
The FXPROFESSOR

SAND waiting for news to grow !We are moving down, waiting for the FOMC meeting, the market may turn sharply!
Subscribe to tradingview!. stay tuned for ideas! Links below

wedgesand usdt is tryna to make a wedge in 15m timeframe if it can consolidation it self on the trend line. <>

Sand Perfect Long EntryThe next targets for this parabolic bull run are as follows:
First target: $4.25
Second target: $5.99
Third target: $7.72
Fourth target: $8.79
The Sandbox has recently raised $93 million in a funding round led by SoftBank to help grow its virtual world based on NFTs. The money comes an estimated $30 billion fund from one of the world’s biggest companies. Other investors in the round included Animoca Brands, True Global Ventures, Liberty City Ventures, Galaxy Interactive, Kingsway Capital, Blue Pool Capital, LG Technology Ventures, Alpaca VC, Graticule Asset Management Asia, Com2uS, executives at GoldenTree Asset Management, Nokota, Sun Hung Kai & Co, Sound Ventures, Red Beard Ventures, SCB 10X, Polygon Studios, Samsung Next, Double Down Partners, StakeFish, SterlingVC, and HodlCo.
Arthur Madrid, CEO of The Sandbox, said that the money will help the company grow beyond gaming into economies such as fashion, architecture, virtual concerts and shows, art galleries, museums, and more. Madrid and his cofounder Sebastien Borget said they want to build the metaverse.
venturebeat.com


SANDUSD ❕ trading in rangeSAND moves in range after touching the lower boundary.
Volatility has declined.
Price successfully tested 200MA as support (4H TF)
TD Sequential has formed an up reversal signal (30m TF)
I think SAND will continue to move in range if it fixes above resistance.

SANDUSDT | BREAKOUT LEVELDecentraland and SandBox could offer another breakout from the horizontal level.
Sandbox looks like it can offer huge spike to more than 2.5$ if it manages to close above 1.5240 level.
We have seen a clean breakout from the falling resistance previosuly on 25th june but since then price remain in the range and unable to break 1.5240$
What do you think of the idea?

SANDUSDTSANDUSDT(08.14.2022 UPDATED)
Wait until price touches the trend lines then look for signal bar and key bar /Breakout and pullback to recognize direction of price movement.
Money Management must be obeyed.
Open position without setting the proper stop loss (1% or 2% of total balance ) soon or late will cause to lose all your money ( call margin )
Majority of trades is done via computer trading (forex / cryptocurrency)
priority in analyzing charts:
1- Price Action
2- Market structure
3- Chart patterns
4- Candlestick patterns
5-Divergence
6-Indicators

SAND.UsdT (Y22.P3.Video1). Don't like itHI All,
Just my thoughts, rather wait for more bullish signs before entering.
all the best,
S.SAri

SANDUSDT is testing the 4h resistance
The price is inside a descending channel on the 4h timeframe and now the price is testing the resistance.
How to approach it?
The price needs to create a clear breakout from the resistance and retest it as new support, so According to Plancton's strategy , we can set a nice order
–––––
Keep in mind.
🟣 Purple structure -> Monthly structure.
🔴 Red structure -> Weekly structure.
🔵 Blue structure -> Daily structure.
🟡 Yellow structure -> 4h structure.
–––––
Follow the Shrimp 🦐

SAND broke the triangle pattern.The following content is machine translated:
In the 4-hour chart, it fell back after yesterday's false breakthrough, and today it broke through successfully and continues to be bullish.
Indicators macd and RSI indicators are bullish trends.
Summary: The breakout pattern and indicators are both in the bullish range and continue to be bullish. The short-term target is to look at the resistance near 1.5, and the breakthrough continues to look at a higher position, such as near 2.

SandUsdt is about to break the resistance?Wait till the break out of the triangle is confirmed and then we can take a long position with a good R/R...
Entry:1.36
SL: 1.29
1st TP: 1.71
2nd TP: 2.11
R/R:

Trading opportunity for SANDUSDT SandboxBased on technical factors there is a Long position in :
📊 SANDUSDT Sandbox
🔵 Long Now 1.3543
🧯 Stop loss 1.1120
🏹 Target 1 1.4747
🏹 Target 2 1.8686
🏹 Target 3 2.4343
💸Capital : 1%
We hope it is profitable for you ❤️
Please support our activity with your likes👍 and comments📝

SandUsdtThis one here I have been watching for a minute. I pulled the trigger and got in at the green line and almost got stopped out. But it’s been going wayside. It’s see if I can hit my target with 5x leverage.


SAND/USDTSAND/USDT
It is in a descending channel.
It is expected that if the $1.3 range is broken, the price will increase to $2.25
#SANDUSDT #SAND #BTCUSDT #BTC #ETHUSDT #DOGE #DOGEUSDT

The Sandbox SAND Entry Range, Take Profit and Stop LossSAND/USDT
Entry Range: $1.29 - 1.38
Take Profit 1: $1.70
Take Profit 2: $2.00
Take Profit 3: $2.40
Stop Loss: $1.05

Bitcoin dominance. How does it affect the cryptocurrency market?#BTC #altcoins #dominance #education
▪️Bitcoin dominance index - is an indicator that indicates the ratio of bitcoin capitalization to the capitalization of the entire cryptocurrency market.
▪️How does btc dominance affect the market? - When the dominance of bitcoin falls, altcoins begin to rise - this is called the alt season!
▪️Now the dominance is at its minimum values, which means that it will soon begin to grow! Altcoins will be weak during this period of time. Bitcoin may reach $30,000 and go for a correction. So far, these are my thoughts for the near future!
Subscribe. stay tuned for ideas! Links below👇

#SANDUSDT 4H Chart
Price is still in a range showing no major movements. MACD is not clear, RSI and EMAs are both neutral. Price should tap into the major 4h demand at $1.22 and move up from there aiming towards the equal highs at $1.39.
