SAND making a falling wedge patternAs you can see from the chart SAND has made a falling wedge pattern, which is a signal for a major breakout
SANDUSDT trade ideas

SANDBOX the last chance (bottom) and the range market 📖🚀Hello 🐋
Based on the chart, the price is close to the major support (bottom) or better to say the previous zone that started its amazing pump to the upside ✔️
we
expect to see gain besides the range market is acceptable scenario too 📖💡🚀
and
if the price break the rang area to the upside, we will see more gain 🚀
Please, feel free to share your point of view, write it in the comments below, thanks 🐋

SANDUSDT🔥Let's analyze the SAND chart on 1H
SAND is at a not bad support level that was tested several times, the price is kept in the $0.7945 zone
I expect a rebound from the local trend line at about $0.75
✅Don't forget to visit the channel there is a lot of useful information about trading.
✅Write your comments what you think about this coin.

SANDBOX - Sellers seem exhausted hereSANDBOX has managed not to drop further from June 14 and June 15 lows and is still hovering around those levels.
Could sellers be exhausted and can we see a rebound?
Technically yes, stop losses or entry for short at 0.7635
A trade worth taking.
The FXPROFESSOR

SANDThe price has broken through the rising channel and is forming a narrow falling channel. The price is in the area of strong support. If the support level does not hold, the price will fall to the 38.2% Fibo levels and then 50%
#SANDUSDT 2H Chart
Price is still in a range between the weekly demand zone at $0.8 and the 2h breaker at $0.95. MACD is not clear, RSI and EMAs are both neutral. Price is currently showing very ugly price action and we shall wait for a clear break of structure in order to determine further movements.

sand | elliottwave |updated for a bottom nearly there guys this is an updated chart from my previous sand chart wich played out perfectly

The Sandbox (SAND) - June 17hello?
Welcome, traders.
If you "follow", you can always get new information quickly.
Please also click "Like".
Have a good day.
-------------------------------------
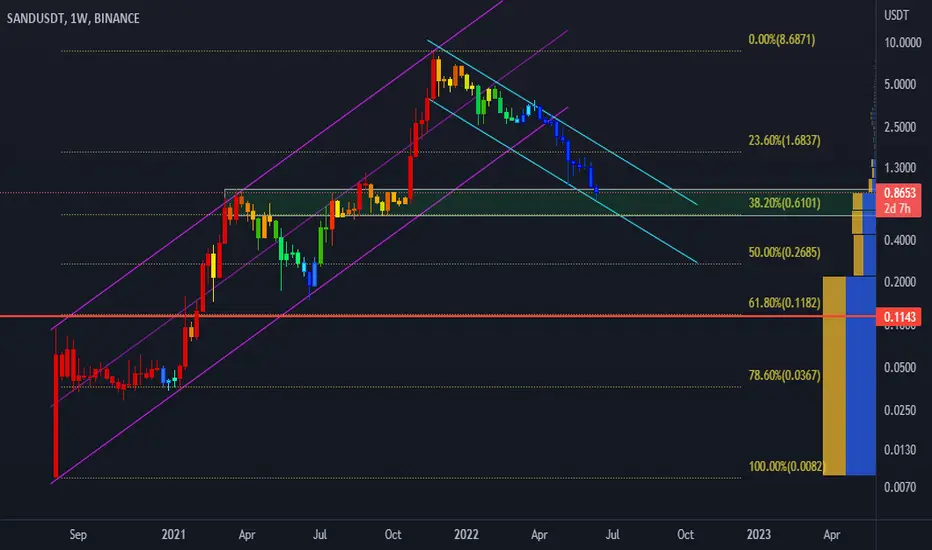
(SANDUSDT 1W Chart)
Below 1.5294 is likely to be a mid- to long-term investment area.
So, whether it can move higher than 1.5294 is the key.
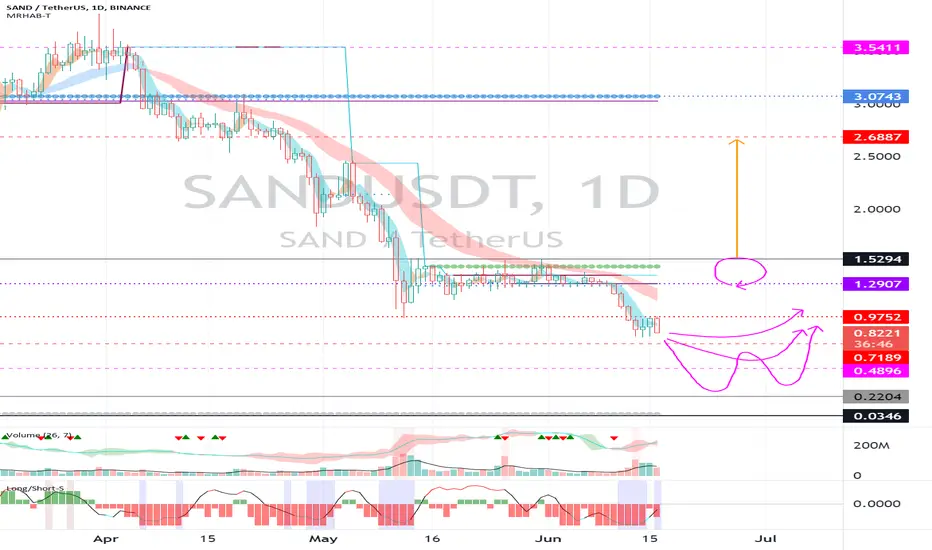
(1D chart)
In the short-term and medium-term perspective, it needs to rise above the 1.2907-1.5294 section to turn into an uptrend.
So, we need to see if we can find support and move higher above 0.7189.
An important volume profile section is formed around 0.2204.
------------------------------------------------------------ -----------------------------------------------------
** All indicators are lagging indicators.
Therefore, it is important to be aware that the indicator will move accordingly as price and volume move.
However, for the sake of convenience, we are talking in reverse for the interpretation of the indicator.
** The MRHAB-T indicator used in the chart is an indicator of our channel that has not been released yet.
** The OBV indicator was re-created by applying a formula to the DepthHouse Trading indicator, an indicator disclosed by oh92. (Thanks for this.)
** Support or resistance is based on the closing price of the 1D chart.
** All descriptions are for reference only and do not guarantee a profit or loss in investment.
(Short-term Stop Loss can be said to be a point where profit and loss can be preserved or additional entry can be made through split trading. It is a short-term investment perspective.)
---------------------------------
SANDBOX ⌛🦜 -Starting to smell like a 'BUY ME AGAIN' 🏴☠️☠SANDBOX is approaching major levels. We had to go short after this level broke:
(you really got to learn how to switch to short positions, especially if you are holding spot, once this kind of levels break under/lower).
In any case, it's a GREAT project and one we like to Buy.. and that time could be approaching fast.
One Love,
the FXPROFESSOR

Still i believe its better to look for btc bottoms...xDSand is still holding on that previous trend resistance before price went parrabolic, we are all waiting for a breack out but beware of fake out.

sand | eliottwave targets |A possible bottom for sand is projected in this chart , curently sand is still in wave 4 with the target at 1.63$ , i'm thinking when bitcoin have that wave 2 pump will bring sand to his target , and when btc goes down to the 23k will bring sand at 0.70c for a possoble bottom ! cheers and have a nice day :)

$SAND/USDT 2h (#BinanceFutures) Ascending triangle on supportThe Sandbox is pulling back to descending TL / 200MA which is about to golden cross with 50MA!
Current Price= 1.3503
Buy Entry = 1.3472 - 1.2470
Take Profit= 1.6099 | 1.8454 | 2.1595
Stop Loss= 1.0354
Risk/Reward= 1:1.2 | 1:2.1 | 1:3.3
Expected Profit= +24.12% | +42.27% | +66.49%
Possible Loss= -20.18%
Fib. Retracement= 0.559 | 0.702 | 0.883
Margin Leverage= 1x
Estimated Gain-time= 10 days
Tags: #SAND #SANDUSDT #NFT #Metaverse #P2E #Gaming #Creation #Launchpad #DeFi #SolEco
Website: www.sandbox.game
Contracts:
#ERC20 0x3845badAde8e6dFF049820680d1F14bD3903a5d0
#SPL 49c7WuCZkQgc3M4qH8WuEUNXfgwupZf1xqWkDQ7gjRGt

SANDBOX ⌛🦜 - Time for a Relief Rebound 🏴☠️☠SANDBOX at support and we have an entry for a relief rebound to hopefully 1,43
Market (BTC chart is key) is expected to go sideways as we have informed you a few times before:
Unlike MANA Decentraland, SANDBOX is alive and will deliver great things in the future: www.sandbox.game
Not sure if this could be the end of the dip and an amazing time to buy Spot SAND, But technically we see support so we use stop losses here at 1.14... and will take partial profits at 1,40
One Love,
the FXPROFESSOR

SAND - Trade setupDownward breakout through the descending triangle pattern, Looking at the market conditions there will be retest towards the breakout point which is my entry range. It needed to be observed that the retest must take place with low volume therefore indicating weak retracement so that we can enter short side. I'll update once my trade entry got triggered in the update section.
Disclaimer : Anything provided here is not a financial advice.

SAND will fall like sand!🔥🔥Subscribe to the channel, get notifications about signals!🔥
#SAND
▪️In the near future will fall by -30%. I don't see any growth opportunities. Meet me at the next stop $0.87

The Sandbox SAND Entry Range, Take Profits and Stop Losstargets reached here
SAND/USDT short
Entry Range: $1.20 - 1.36
Take Profit 1: $1.10
Take Profit 2: $0.97
Take Profit 3: $0.60
Stop Loss: $1.52

SANDUSDT🔥 LONG?!!!!💡#sand the price got into the supply zone, but I think it's not worth waiting much, they can still shed about 1.1850$ Can happen against the background of the #BTC spill. Now the chart looks bearish.
▫️You can also consider SHORT for a countertrend breakdown, I'll just watch, if I see a breakdown, I'll consider LONG🔥
✅Do not forget to visit the channel there is a lot of useful information about trading.

#SANDUSDT 2H Chart
Price has tapped into the 3h supply zone and got rejected heavily from there. MACD is not clear, RSI and EMAs are both neutral. I am expecting it to keep moving down towards the 5mins demand as a short term target.

Should i accumulate gaming coin, well i kinda love sandboxWe all Know Btc by now is going to 20 22 k, but there is a lot more money to be made in the upper side, but depends on how low, you able to long from. Good luck

SAND DESCENDING TRIANGLE PATTERNSAND BINANCE:SANDUSDT is forming a Descenidng Triangle pattern....
I know that in Technical terms, it is mostly regarded as a sign of bearish pattern.... But sometimes it can be powerfully Bullish too!!
I think it might fool sellers when it make a pullback near Demand zone and might continue back to the 1st Target area...
If you can relate.... then please like and ask any comment you guyzz have!! (:

Trading opportunity for SANDUSDTBased on technical factors there is a short position in :
📊 SANDUSDT
🔴 Short Now 1.2824
🧯 Stop loss 1.5400
🏹 Target 1 1.1100
🏹 Target 2 0.9000
🏹 Target 3 0.5700
💸Capital : 1%
We hope it is profitable for you ❤️
Please support our activity with your likes👍 and comments📝

SAND/USDT is bouncyHey guys
We see a possible scenario for the SAND. We see nice sideways path where it is a good time to make some short-term trades. Also the market is oversold which gives us a hint about a big movement soon.
If you like ideas provided by our team you can show us your support by liking and commenting.
Yours Sincerely,
Swallow Team.
Disclamer:
We are not financial advisors. The content that we share on this website are for educational purposes and are our own personal opinions.

