santos breaking out of fallingseems like getting ready for massive recovery formed and breaking falling wedge in daily tf incase of successful breakout expecting 150%+ Bullish Rally Keep Eyes On For Confirmed Breakout
SANTOSUSDT trade ideas


SANTOSUSDT 57.63% ✅🚀🤑#SANTOSUSDT
we published and shared this idea with you in our profile here as you can check the previous analysis for #SANTOSUSDT
and this analysis gave really good and massive profits
Target 2️⃣ : done✅
Entry price: 4.454$✅
Price reached :7.021$ ✅
period: 2 Days.
Profit: 57.63% ✅🚀🚀🤑

SANTOSUSDT#SANTOSUSDT
we are in powerful support zone and we have very important and strong support zone i expect the price will fly to the target at the chart i expect there will be a correction move dont's miss up this opportunity Parabolic SAR is bullish Ichimoku cloud is bullish EMAs is neutral MACD is showing bullish RSI is neutral Accumulation distribution is bullish Fib retracement is neutral

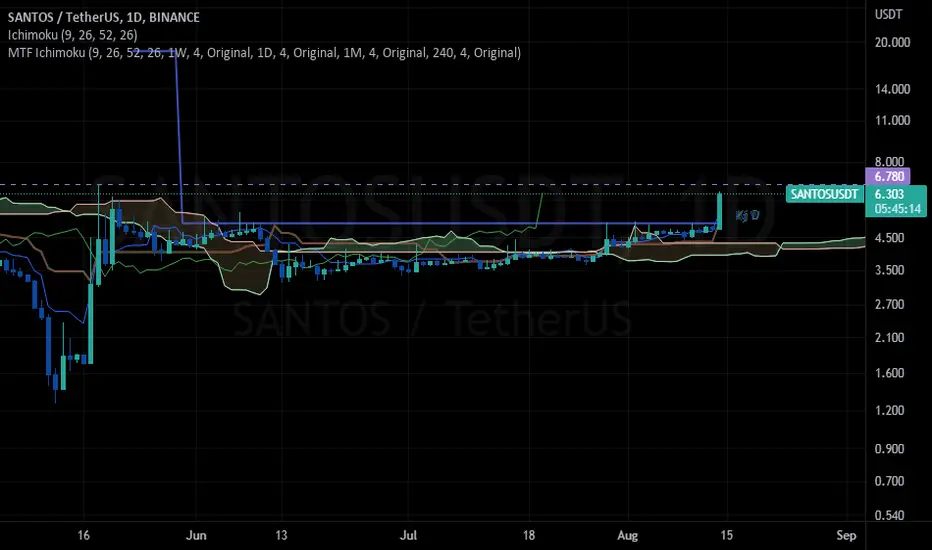
Santos FC Fan Token Price ForecastThis 4h chart on Santos FC Fan Token show price broke the resistance at around $6.30 and now it is retesting. Possible buying areas in my opinion.


#SANTOS/USDT: BBandBreakout - SuperTrendWe've identified both a Bollinger Band breakout and a Super Trend pattern on the $SANTOS/$USDT chart. Both indicators are signaling a bullish trend, with the Bollinger Band indicating a potential bullish trend as the price has moved outside of the upper band and the Super Trend showing a bullish trend. This is a stronger bullish signal as both indicators are aligned. It may be a good idea to consider buying at the current price zone and targeting higher levels. However, it is still important to consider other factors such as overall market conditions, and other technical indicators before making a trade decision.

SANTOS STATUSHello good time
I hope you are well
I think a deep correction is waiting for this symbol. If it reaches the specified green support range, we can think about buying. Don't forget capital management, leverage and stop setting
Comment if you have any questions
Thank You

SANOTS Santos already finished 5 waves as a bullish impulse wave and the rule says after getting an amuse wave you get a correction ( ABC ) then you will get another mules wave
so we almost got A now we expected to get B the issue now is that I do not know what kind of correction we going to get but if we break the top ( red line ) we expect to get wave C so be carful you are in the correction
peace :)

SANTOS BUY SETUPHello, dear traders. how are you ? Today we have a setup to buy/long the SANTOS symbol.
For risk management, please don't forget stop loss and capital management
When we reach the first target, save some profit and then change the stop to entry
Comment if you have any questions
Thank You

SANTOSUSDT - FOR FOOTBALL FANSSANTOSUSDT has retraced to 0.618 fib level and available at key support. Upside move is on the cards from here, SL is the key

SANTOS SPOT BUY (SWING TRADE)FIFA WORLD CUP is coming next month.
I can see Football coins pumping in the next few weeks (Buy the rumor sell the news).
I will be accumulating Santos coin from 10 to 11.05


SANTOSUSDT - EITHER WAYSANTOSUSDT
Bullish Points:
1. Doji Candle @ TL Support
2. Horizontal Support Level
3. Oversold RSI (4H)
4. 20% Weightage in FOOTBALLUSDT Token which is trading in oversold region
Bearish Point:
1. If the neckline of range Breaks, significant fall is on the cards.

BINANCE:SANTOSUSDTBINANCE:SANTOSUSDT
#SANTOS/USDT
REASON
1)UPTREND
2) REVERSAL
UP
1) in the UP trend
2) In CHANNEL Breakout
3) High Volatile#SANTOS/USDT
Signal Type: LONG
TRADE WITH YOUR OWN RISK


SANTOS USDT SHORT SWING| SANTOSUSDT | SHORT @ 16 - 12 | TP @ 11, 10, 9, 8, 7 | SL @ 19 | PATTERN = SPREAD TRIPLE BOTTOM BREAKDOWN | BINANCE |
Swing trade idea. Kindly follow targets and stop loss. Will update with new targets once all 5 are achieved. Mostly trading with PNF charts, MACD, RSI, Stoch, BPI, Cipher, MA/EMA, Support/Resistance on hourly timeframes and higher time frames
BINANCE:SANTOSUSDT BINANCE:SANTOSBUSD BINANCE:SANTOSUSD


SANTOSUSDT#SANTOS Update:
As #Santos has made huge pump. Now price is entering in Bearish Territory.This token is highly overbought and bearish divergence suggesting that a dump is pending. You can re enter in minor to local support.

Santos +449% after BULL signal 🚀🚀 Retrace imminent?SANTOS pumped 449% (green price range) after the bull Supertrend Ninja - Clean signals (green vertical line on the background).
RSI at 95 is heavily overbought. I do not see any bearish divergences forming on the RSI Brown or RSI on the daily chart. Although I expect a retrace to be likely before another run up. It really depends on BTC going sideways instead of going down more. If we take a look at the Average Directional Index ( ADX DI) its still in the bullish zone. Currently SANTOS is way above its Basis Bollinger Band , Band Basis 20 Period SMA . And above the LSMA as well.
A healthy retrace first, before another run up to is a possible scenario. But it most likely needs BTC to go sideways for this to happen. Buying here is NOT recommended. Support and resistances are highlighted as grey and light green horizontal blocks.
Remember to always take profits and use proper risk management!
Thank you for reading.
Namasté 🙏
Disclaimer: Ideas are for entertainment purposes only. Not financial advice. Your own due diligence is highly advised before entering trades. Past performance is no guarantee of future returns.
What Indicators Do I Like To Use:
I am using the "Supertrend Ninja - Clean", which is a trend-following indicator (Green and red vertical lines on the background). When the background of the candlestick closes green (vertical line). It indicates a possible bullish (up)trend. And red for possible downtrends.