The new phase begin soonthe bullish still valid, i am totally noob and i still learning, so be careful
SCBTC trade ideas


Siacoin - Rinse and RepeatBefore we dive into today's analysis, I'd like to thank you all for your continued support in helping me reach 5,000+ followers, I'm extremely grateful!
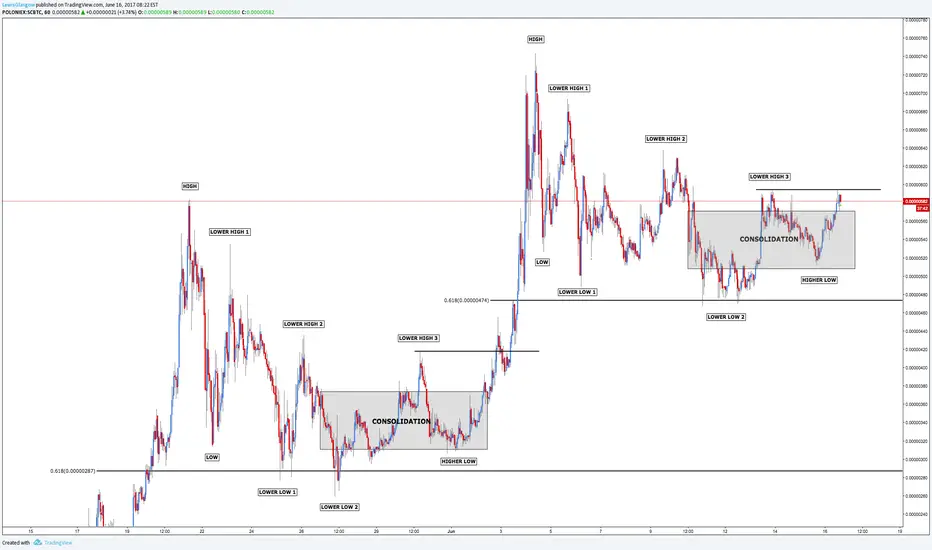
The setup displayed in front of you today is a prime example of market cycles repeating themselves, I have clearly illustrated on the chart the similarities between the two extended moves up.
I'll strip this chart down from top to bottom.
Firstly, you can see both moves up fell back to the 0.618 retracement level before finding a solid support.
Both carrying similarities in terms of time and price, you can see move 1 lasted 5 days and 20 hours counting up to 140 price bars.
Move 2, on the other hand, lasted 6 days and 17 hours counting up to 161 price bars.
Taking a look at the chart shown below we experienced a very similar move in terms of price structure as well.
Both start off from high to low, of course, followed by a further 3 lower highs and 2 lower lows.
From there we saw a lot of consolidation before price direction suddenly changed as both created a higher low at a solid level of support.
Following the higher low, both re-tested the previous high (lower high 3).
In the first situation, this is what sparked the move up to 740.
Will we see a similar breakout to reach 900? Only time will tell.

Mid-term SC prospects. It's going to be an interesting ride!This chart is highly speculative because of the large timespan, but it can't hurt to have look. The previous wedge resistance charts I've made have been remarkably successful so I scaled this one up to a mid-term chart. I believe we are in the middle of the first of several cup and handle formations, which will get increasingly larger. My target is maybe 750 sats by the end of the month. 1000 sats by mid July. Maybe i'm just blindly optimistic. Anyway, don't panic if we drop into the 400s this week or next, SC has proven herself remarkable strong, even in the fact of BTC tyranny. Stay strong my friends, hold, and enjoy profits!


Sia SCBTC - It's Cup & Handles All the Way Down (or...UP)Looks like the handle from my previous idea is its own smaller Cup & Handle. That makes 3 nested C&H's so far lol. This thing wants to go up.


Sia SCBTC - Slightly Shorter Term TargetsThis is related to my other idea:
I zoomed in so we can see the target area for the more immediate future.
Looks like we've got a cup & handle (or inverse head & shoulders, both work in this case).
It might want to extend past the target and hit one or both of the previous peaks (I labelled them on the chart) so I drew a wider target area.
Of course I believe it will ultimately blow past all of these targets and hit at least the next fibonacci level around .00000905, but thought I'd include this if you want a shorter term goal.

SC - SIA Coin BuyingZone ahead !SIA has resolved the wallet problems with bittrex and poloniex.. time to continue with the journey to the moon

Very similar fractal turning out.History repeats? Early entry now, add if going lower towards the trend line, stops below trend line.

$SC update - Answer Mr Pop from IndiaSC uptrend until. And now he will creat uptrend to 1400 - 1500 sts . God bless you. Thanks so much for follow me


SC/BTC Possible breakout in a couple of daysPossible break out by tomorrow, always set stoplosses around 10% (my preference)

Sia (See y'a) at the top!SIA is progressing in upward trending within a channel.
My guesstimate it will get down to touch the bottom line of the channel (best time to buy) then bounce up like a rocket ! ... Sia at the top ! :-D
Best of Luck!
--------------------------
Disclaimer: Ideas I share are for pure demonstration based on my own research and/or charting. One should do the due diligence researching before taking decision to invest.
If my ideas brought you wealth and happiness and wished to share some with me, feel free ;-P
BTC: 16qTPwgnK1kiNRDQe9UYy9GpaQ3z48u7E7
ETH: 0xecf24423cdbf32246fb91c674c686fce2942b4c9
Sia: f4b44cdfb0b5a84388d9a1d5019b31bfe3e6ebee31de72712a5878e659a70e0f368afff9e445

Long SC GODMODE 1hrGod mode indicating SC has reached what is probably the last turning point before making a large move higher.
I expect the trend to shift to up again based on god mode analysis but I don't know how high... What I do know is that this is good entry point for anyone who thinks SC will begin it move to the 1200 sat area as the trade should play out rather fast. Time will tell. Good luck.
