Secret Network | Long-Term Potential Goes Beyond 1,000%Now, this is truly short-term... The 215% target.
Secret Network is trading at a new All-Time Low and growth potential goes beyond 1,000%... It will be something big.
But this chart only shows the reversal and short-term signals. Once we are in, a great entry price, the market will take care of t
Related coins

✳️ Secret Network Can Go Beyond 2,000% Within MonthsSecret Network (SCRTBTC) is in the process of producing a very strong reversal candlestick in the form of a DragonFly Doji, at the same time a higher low compared to October 2023.
This development can lead to strong growth... In the case of a trade, this chart setup has very low risk with huge pote

✳️ Secret Network Hits Bottom | 945% Is Not The Final TargetHave you seen all those charts that already produced great growth? The ones I continue to publish on a daily basis?
What do they have in common with Secret Network (SCRTBTC)?
Don't worry I'll tell you!
They all hit bottom mid- to late October 2023.
Here we can see SCRTBTC just hit bottom recently

$SCRT/#BTC [#Secret]: Trend_Reversal◳◱ Hey traders, we've identified a Trend Reversal on the $SCRT / $BTC chart. The trend of the price has reversed, indicating a potential trend change. The next resistance levels are located at 0.00003534 | 0.00003776 | 0.00004191, while the main support levels can be found at 0.00003119 | 0.00002946

Secret coin (SCRT) formed bullish Gartley for upto 44.50 pumpHi, friends hope you are well and welcome to the new update on Secret coin with Bitcoin pair.
In the previous trade-setup, the priceline of SCRT was pumped but after a long spike on 4th March, it was dropped down.
Now on a daily time frame, SCRT has formed a bullish Gartley pattern.
Note: Abo

Silent TA - (ASMR) 2Decided to make a video going thru my everyday charting process, sorting which crypto opportunities stand out best at the moment.
No talking, just mouse clicking.

SCRT/BTC - upcoming events - bullish ideaNo investment advice!
I do this only for practicing.
Most info on the Chart.
Keep in mind if the big two ( BTC , ETH dropping) this will be dropping too.
Trade carefully!

Great Charts 1/3 (UPDATE)Update 1 to my previous videos linked below.
Multiple personal views of the 37 best charts currently in the market split into 3 videos.

Scrt vs btcTrendline breakout and retest successful
All target in take on chart
🚀🚀🚀50% profit possible

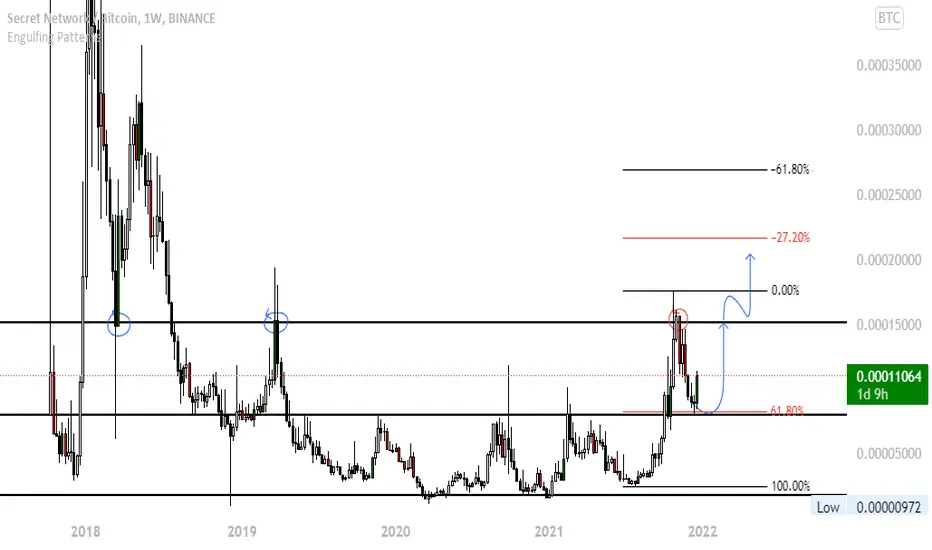
SCRT/BTCWeekly range broken ---> last weekly high (19') tested --> broken range retested and rejected with a strong bullish engulfing candle.
Weekly 7/21/25 EMA's tested and rejected, which is a common mean reversion point.
61% Pull Back and rejection
All good signs and a great chart IMO.
Previous analy
See all ideas
Summarizing what the indicators are suggesting.
Oscillators
Neutral
SellBuy
Strong sellStrong buy
Strong sellSellNeutralBuyStrong buy
Oscillators
Neutral
SellBuy
Strong sellStrong buy
Strong sellSellNeutralBuyStrong buy
Summary
Neutral
SellBuy
Strong sellStrong buy
Strong sellSellNeutralBuyStrong buy
Summary
Neutral
SellBuy
Strong sellStrong buy
Strong sellSellNeutralBuyStrong buy
Summary
Neutral
SellBuy
Strong sellStrong buy
Strong sellSellNeutralBuyStrong buy
Moving Averages
Neutral
SellBuy
Strong sellStrong buy
Strong sellSellNeutralBuyStrong buy
Moving Averages
Neutral
SellBuy
Strong sellStrong buy
Strong sellSellNeutralBuyStrong buy
Displays a symbol's price movements over previous years to identify recurring trends.