SCUSDT trade ideas


Summer TimeGet ready🔥
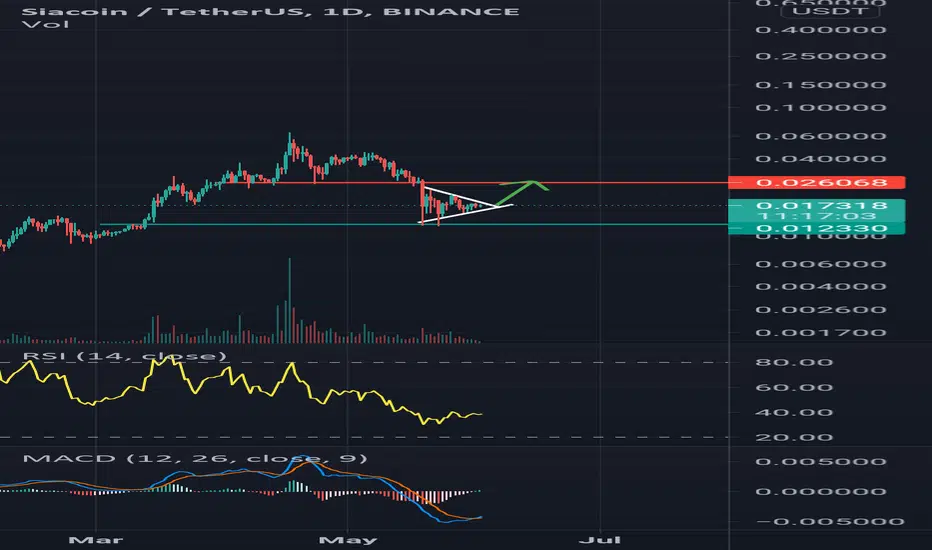
There is an interesting formation.
Symmetrical triangle on SC/USDT crypto pair.
No more words!
Follow the chart and look for the breakout carefully.
_____________________________________________________
If you enjoy my FREE Technical Analysis , support the idea with a big LIKE👍 and don't forget to SUBSCRIBE my channel, you won't miss anything!
Feel free to leave comments✉️
And always remember: "we don't predict, we react".


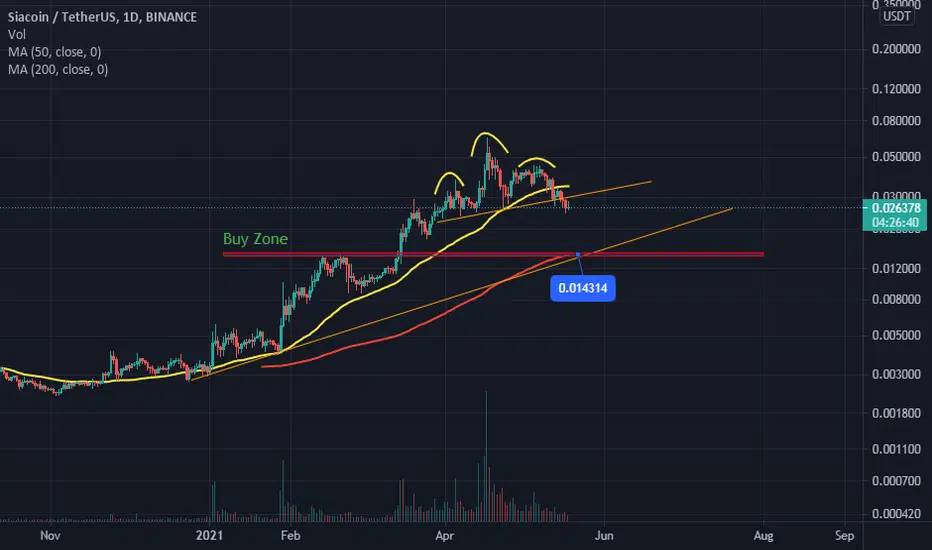
Siacoin does not intend to climbOver the past few days, Siaquin has broken a lot of support due to the bitcoin downturn And because of this, the price experienced a significant drop.Today, in the relevant chart, we see that Siaoin has formed a descending triangle pattern.As the price approaches the important support level of 0.014, it can be an immediate signal for sale If this support fails, according to the pattern formed, we can still wait for the price to fall.
This is just a technical analysis.
This is not a financial recommendation.

SCUSDT Technical AnalysisSCUSDT
⬆️Buy now or Buy at 0.0182
⭕️SL @ 0.0153
✅TP1 @ 0.0237
✅TP2 @ 0.0309
✅TP3 @ 0.0439

Siacoin Is About to Explode 🚀 🚀 🚀💡 Trade Idea
📈 SC/USDT Buy Market Order @ 0.02115
🎯 Target Profit 0.02445
🛑 Stop Loss 0.01952
❌ Do not risk more than 1% of your account on each trade
🙂 Good Luck!
Description:
The price is trading inside the wedge pattern where we have seen higher lows that led to a breakout of the strong resistance to the upside. Currently, the price is correcting toward the support (previously resistance), and after that we expect a huge rally toward our target profit.
-------------------------------------------------------------------------------------
Please press “Like” if you appreciate the trading idea 👍
“Follow” for more trading ideas in the future 👀
“Comment” below to share your thoughts with us and other traders 👥
-------------------------------------------------------------------------------------
Risk Disclaimer: All trading ideas published by “collegeofpips” are for educational purposes only. These posts can help you to enhance your trading skills, but please do your own research before opening any trading position. ⚠️

Request Sia/Fiat @Goodvibesonlyr/r 6.33
r/r2 9
Looks like bear flag forming, fade the rally @ 50% retracement of the May 19 candle
still waiting for bullish reversal
especially going into the weekend, you should know low volatility, bot accumulation...boring
plan prep revise revision relax
Sia in Eth looks to be accumulation cup and handle
be advised sc/eth ratio is always subjected to eth sentiment and volition
coin in fiat pair is so much easier to trade
Safe to say, price action bottoming
so be bearish with your sentiment until the market indicates other wise
Enjoy the corrective wave
you dont get this sort of price discovery in any other market
CryptoCurrencyConsultant
.3 LTC 30 day member
.6 LTC lifetime member
.9 LTC exclusive crypto coaching
Lf55wxFjbSrmsYnscjtrDLNZoZFLjJPs8U

SC/USDT Welcome Back.
Please support this idea with LIKE if you find it useful.
***
SC tested support level of 0.25500 two times and bounce again trying to break the downside trend, we will be positive in SC after daily candle close above 0.28 .
***


SCUSDT prepare to take off SCUSDT broke teh accumlation area and retestting ongoing
waiiting to complte for take off to the grean lines as the targets
best of luck

double bottom , potential uptrend, resistance to be brokenas we can see sellers are in control, yet buyers are moving ,,, will see a decent fight then potential uptrend
Check TP1

2 W pattern We have two double bottom pattern
One big and other small
Wait the break out and confirmation


SiaCoin - Down Down DownAnalysis:
- Fibonacci Retracement
- Support & Resistance
- Trendline Analysis
- Order Block Flow
Target 1: $0.017
Target 2: $0.014
Target 3: $0.008
Opinion:
SiaCoin has entered a corrective cycle
I have laid out potential targets
I believe when SiaCoin crosses the Green Line that will end the correction
I will do a follow up bullish markup when this idea concludes


SC (SIA COIN) - As you askedSia Coin has 2 potential Target areas but first it needs to cross the 0.04 resistance.
Don't FOMO, wait for the breakout confirmation.
I've put the support and TP areas on the chart.
⚠️ NOTE: This usually happens when a coin gets hot on crypto platforms: it might go down by a little and then get back up to a new high.
Good Luck 🎲
Tell me your ideas. Like and Share 🗣✅

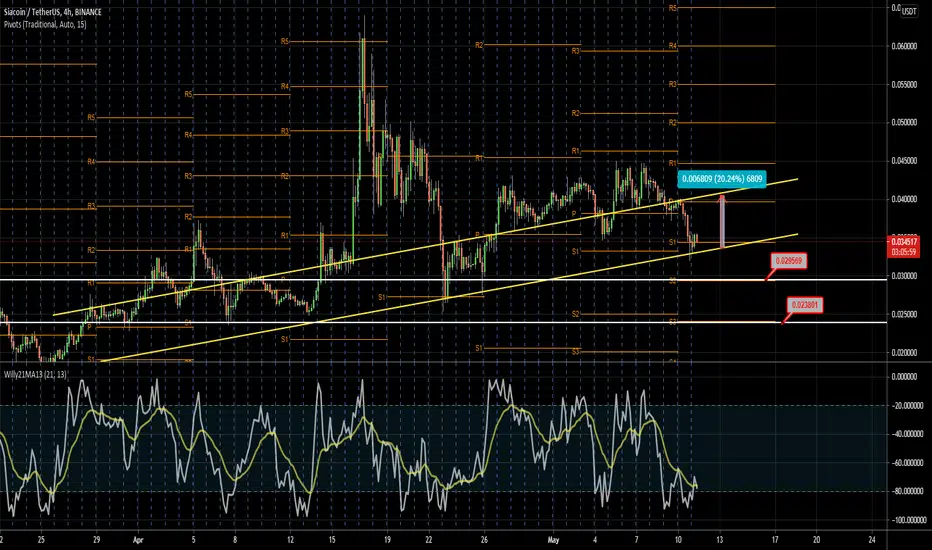
Siacoin Crypto The Next King Of Storage SectorThe 4-hour technical chart of SC crypto projects a positive trend. According to pivot points, Siacoin’s critical support level is $0.03462. Whereas if it moves upside, the crucial resistance to watch is $0.04439. Besides, the chart also features a bearish pin bar candle showing a bearish trend with low reliability.
The Exponential Moving Average (EMA), consisting of EMA 20 & 50, acts as solid support in the coin’s price. EMA 20 is moving beneath the EMA-50 line, indicating bearish momentum. Investors may perceive the price is also trying to get above EMA-20. So until the price remains below both EMA, it will ensure Siacoin’s bearish momentum.
The CCI (Bearish) with the value of -33 indicates a sell signal in the coin, and the line went down from 24 to -33 on intraday session considered to be in an oversold region. It may plunge in short-term trading sessions.
The volume of (2.26M) showcases below the Volume MA (2.82M) of 20-days. The investors in Siacoin are maintaining the order book to sustain their price at current levels. Investors may also observe declining volume in the chart, indicating a big move is expected soon.
The parabolic SAR indicator suggests a buy signal in SC on intraday. No signs of a sell signal have been seen, which is an excellent sign for Siacoin’s investors.