SCUSDT realized 280% 🚀🚀🚀🤑#SCUSDT
we published and shared this idea with you in our profile here as you can check the previous analysis for #SCUSDT
and this analysis gave really good and massive profits
All Targets : done✅
Entry price: 0.00254$✅
Price reached : 0.00710$ ✅
Profit: 279% ✅🚀🚀🚀🤑
Thank you, and for more ideas, hit "Like" and "Follow"!
You may also TELL ME in the comments section which symbol you want me to analyze next and on which time-frame. The one with the most posts will be published tomorrow! 👏🎁
SCUSDT trade ideas

SCUSDT(Siacoin) Daily tf Range Updated till 8-02-23another alt with massive retrace which is over 220%+ gains.#0.00583 is a midrange resistance for now. if it clears it there are good empty space till upper level. it wont require much to push if retail interest keeps it.

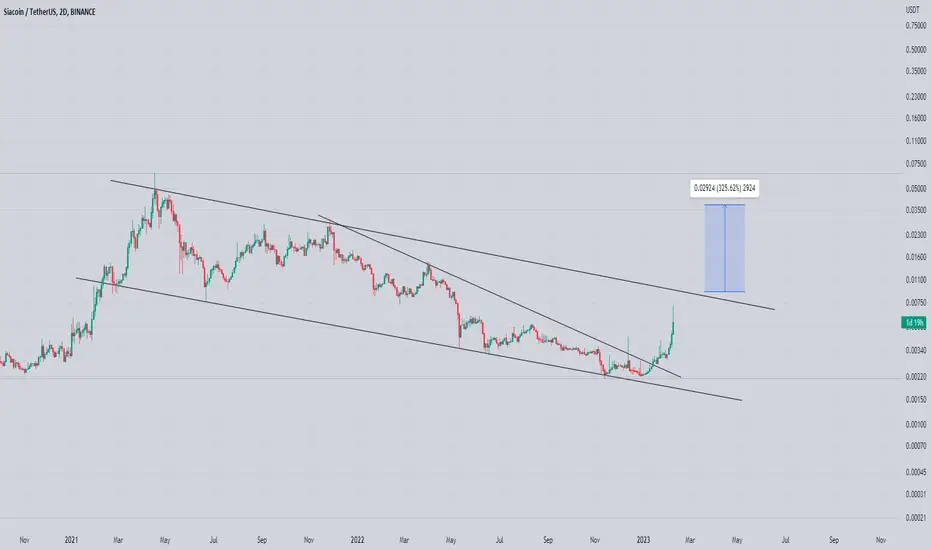
Sia Coin Preparing For Something Big approaching towards Key Resistance
Forming Descending Channel In 2day timeframe
Incase Of breakout Expecting Another 300 to 350% bulish Move
Wait Patiently For Breakout To be Confirmed
$SC/#USDT [#Siacoin]: ResistanceBreakout+ConfirmationWe've detected a Resistance Breakout and Confirmation on the $SC/$USDT chart. The price has broken above a key resistance level and has been confirmed by a strong candle, indicating a potential bullish trend. We may consider buying at the current price zone and targetting higher level.
HOLDING BOTTOM FOR BOTTOM OUT#SCUSDT.... Hope so if hold bottom in day chart .. than bounce expected and possible it will be final bottom for now
Good luck....

SCUSDhitting trendline around 5 times and again testing it lets see will it break or hammered down again...

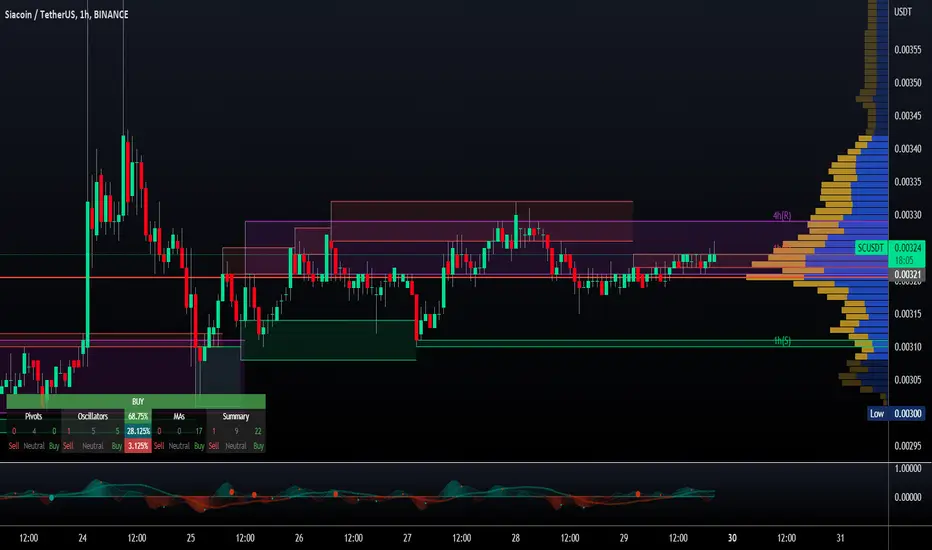
SCU USDT 14/12/22 2:28PMALPHA CALL ( drop down under EMA 10, Time to short)
ENTRY: 0.00299-0.00305
Cut Loss: 0.00335
Take profit 1 : 0.00276
Take profit 2 : 0.00247
close market in 36hrs as FOMC on thurdays. Probably a long, since CPI is good yesterday

Siacoin (SC) formed a bullish Gartley for upto 57% pumpHi dear friends, hope you are well, and welcome to the new update on Siacoin (SC) with US Dollar pair.
Previously we had a nice trade of SC .
Now on a 4-hr time frame, SC has formed a bullish Gartley pattern.
Note: Above idea is for educational purpose only. It is advised to diversify and strictly follow the stop loss, and don't get stuck with trade

SiaCoin ready for 100%SiaCoin yesterday showed us clear signs of uptrend and now it's in the 290-300 support, and waiting for the explosion!
Investors have their eyes on it, and you should also check it out.
THIS IS NOT A FINANCIAL ADVICE, PLEASE INVEST AT YOUR OWN RISK

SCUSDT#SCUSDT
we published and shared this idea with you and gave good profits
Target 3️⃣ : done✅
Price reached : 0.00422$ ✅
Profit: 66.14 %🚀🤑
🔥🔥

SCUSDT#SCUSDT
we shared this idea with you and gave right good profits
Target 3️⃣ : done✅
Price reached : 0.00422$ ✅
Profit: 66.14 %🚀🤑
🔥🔥

SCUSDTFormed Falling Wedge In daily timeframe
and cyrrently testing tl in daily tf incase of breakout expecting massive bulish wave

SCUSDT#SCUSDT
we have falling wedge pattern and powerful support zone in 10/2020 price flew from this powerful support zone to 2240% i expect the price will fly to the target at the chart and
will pump following Bitcoin ( BTCUSD ) dont's miss up this opportunity buy and hold it to the next targets at the chart MACD is showing bullish RSI showing bullish EMAs is neutral Ichimoku cloud is bullish Parabolic SAR is neutral Accumulation distribution is bullish Fib retracement is showing bullish ZELMA is showing uptrend-move Awesome oscillator in neutral

SC LONG#SCUSDT
There’s a double bottom formation on $SC 4HR timeframe chart.
Entry will be a clean break above NECKLINE RESISTANCE.
Target is a +4.76% move to the upside.

SCUSDT, possible Trade idea!Sia coin seems finally has bottomed on a wave 2 or b weekly.
one could start taking long position and addition on pullbacks.
this trade takes months to get to it's max potentials,
good Luck!

$SC Analysis1. 4h Bullish OB mitigated
2. RSI Bullish divergence
3. Waiting to break above the CHOCH

1x for SC I will buy SC .. 100% or less T
I wish you happy profits..
It is not advice to buy or sell everything I post on my page is for me only

SiaCoin SCUSDT - Breaking out! Falling wedge + Triangle- On the daily chart we can spot a falling wedge - bullish reversal pattern that is currently breaking out!
- Also we can see a local ascending triangle, also a reversal pattern.
- As per my Elliott Wave analysis, this impulse wave should be completed successfully.
- Now I am expecting a retracement to 0.618 FIB + previous swing low from February.
- Look at my ideas about another interesting altcoins in the related section down below ↓
- For more ideas please hit "Like" & "Follow"!

SCUSDT - 4h Long signal💡💡#SIGNAL 💡💡
SC / USDT
▶️ Buy NOW
🔴 SLT - 4h (Trigger)
#SCUSDT_4h_060722
There is an uptrend on 1D. At 4h, ready for a breakthrough. The stop on 1D is very far away, so the stop on 4h. If the stop works, I will look for a new entry point.


Siacoin trade optionHeres a possible trade option to take with Siacoin.
You could try and take entry as close to that support as you can, with a tight top loss just below it (invalidation).
Or you could simply wait and long the retest after the break of that horizontal resistance.

SC Breaking Out from its rangeSC or Siacoin is currently attempting to break the upper range + the 0.236 Fib. The current breakout candle has a massive volume spike, and RSI is diverging from the price in the past few days.
If it successfully breaks out, the first good TP will be 0.43 area, where the 0.382 Fib and the previous lower high sits.
Remember to do your analysis first

$SC delisted perpsas the perps get delisted i believe the 17th is when Binance actions it
these coins usually pump 70-120% just saying ,,,,not in this trade already deployed in DEGO foro $3.08 target
