I'm very bullish on siacoin*Not financial advise*
This is the time to start stacking the cryptos you believe in long term. Look at the psychology of market cycles and study it.
I'm very bullish on siacoin as it solves real world problems; siacoin aims to provide decentralized storage. Check out their white paper!
Everyone needs storage and if you believe in NFTs, you best believe the cloud storage sector will boom when they become the norm.
Drop a comment on what you think! open to ideas :)
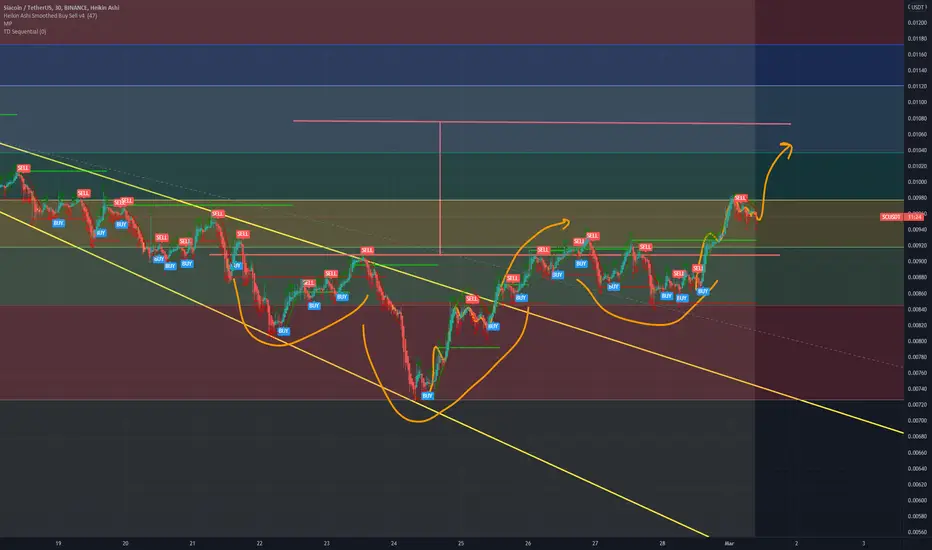
SCUSDT trade ideas

SC - Trendline to be broken ☠️Reasons to take short
⭐️ BTC is bearish
⭐️ Trend bearish
⭐️ Trendline is 13d old
⭐️ Trendline is visible on multiple timeframes
⭐️ Instrument loses power
⭐️ 6th touch
⭐️ Under VWAP
⭐️ 55 ATR
Will enter when price squeezes to the level on lower timeframes, the base will form and the strip will get faster.
If you don't understand the previous sentence, just use swing stop-loss 3-5%
Fix profit by parts:
1% - 1/3
2% - 1/3, stoploss to breakeven
What's left, hold to the maximum
What do you think of this idea? What is your opinion? Share it in the comments📄🖌
If you like the idea, please give it a like. This is the best "Thank you!" for the author 😊
P.S. Always do your own analysis before a trade. Put a stop loss. Fix profit in parts. Withdraw profits in fiat and reward yourself and your loved ones


SC moving goodRisk warning, disclaimer: the above is a personal market judgment based on published information and historical chart data on Tradingview, all analysis is only subjective. Hope investors consider, I am not responsible for your investment decision.
Thank you.
Good luck
Donate me:


SCUSDT - The idea of breaking throughIn 1W at the end of March, SC went uptrend. Now the correction and it looks like it is ending and SC is trying to bounce off a strong level. I will try to enter the breakthrough.

Siacoin analysisIn crypto space there are only few coins who have survived several crashes an one of them is Sia coin ,m it is and great concept for free internet services. Here anyone will to risk 40% can go for swing trad market can give you profit of about 200% or more .
Please like, share and subscribe

SC 3 day chart looking for a breakout soon?SC 3 day chart is finally seeing and end to this madness.
look at how everything we need to breakis in the oarnge circle.
we have the Bull Market support band, 50/100 day ema, its above
the Hull Suite Indicator, RSI is looking Bullish as well. lets watch
whats happening in the Orange circle.

SCUSDT - Waiting for a big correctionSC at 4h closed below the head and shoulders figure. The target for this figure is 0.009 - 0.01. It is dangerous to take a short, because 1D is still ascending and it will look more like a big correction. I will wait for the decline and look for the entry point to the long at the designated levels. There is a strong support zone at the same level.

SCUSDT - 4h long signal💡💡#SIGNAL💡💡
SC / USDT
▶️ Buy NOW + Block
🔴 SLT - 4h (Trigger)
#SCUSDT_4h_050422
******
If you use my ideas please like👍 and subscribe so as not to miss new signals. I find interesting setups and publish them free for you. You just need to like to raise karma 🙏⭐️
May The Force be with you!
******

alwaySC play the pennystocksits a penny guys gotta buy it, 600% gains when it gets to its ath, it will run further to pt of .50 making that a 3000% gain

sc testing resistancesia coin is testing resistance here, needs to flip it support to see a next move up
but if you got in on my previous chart when i called the bottom just enjoy the ride

Siacoin More Gain Is ComingSC/USDT Trying To Form POT , Everything Is Mentioned On The Chart
IF BTC Hold & Recovering
Note: I'm New & Trying To Learn.
This Is not Financial Advice Do your Own Research.
IF You Like My Idea Please Like & Comment For Support
Thanks

sc nice bounce off bottomsia coin had a nice bounce off the bottom support with bull divs
could see a big move coming soon


SC : does it is able to break out?Hi every one , as see you chart above , if it does able to be remain above red line it should be an bullish to 0.01550 area in one step and in two step im sure it would up to 0.023 area
We suppose is that btc stay above 46000 dollar

🆓Siacoin (SC) Mar-27 #SC $SC
SC has started an uptrend after breaking through the $0.01 zone. In April, SC may continue to rise to the $0.015 zone or even higher.
📈RED PLAN
♻️Condition : If 1-Day closes ABOVE 0.01$ zone
🔴Buy : 0.011 - 0.01
🔴Sell : 0.013 - 0.015 - 0.017
📉BLUE PLAN
♻️Condition : If 1-Day closes BELOW 0.01$ zone
🔵Sell : 0.01
🔵Buy : 0.009 - 0.0075
❓Details
📈Red Arrow : Main Direction as RED PLAN
📉Blue Arrow : Back-Up Direction as BLUE PLAN
🟩Green zone : Support zone as BUY section
🟥Red zone : Resistance zone as SELL section

We Are Still Bullish On Siacoin (SCUSDT)We haven't given up on Siacoin (SCUSDT), in fact, things are looking good as its price remain trading above EMA50, which is always great.
We have a strong RSI and MACD bullish as well.
The Siacoin vs Bitcoin (SCBTC) pair is looking good as well, great 'buy' price.
But we need to be patient... The bullish wave will be massive once it takes place.
Namaste.

SCUSDT SIACOIN CHARTTrading Setup:
There is a Trading Signal to Buy in SCUSDT SIACOIN
Traders can open their Buy Trades NOW
⬆️Buy now 0.00875
⭕️SL: Close bellow 0.00718
🔵TP 0.01202
🔵Move SL in 0.01020
What are these signals based on?
Classical Technical Analysis
Price Action Candlesticks Fibonacci
RSI , Smoothed Ichimoku , Break of Trend

SIAUSDT The trend may have changed. The target prices are shown in the analysis. It is advisable to make an entry when the big trend line breaks.

Siacoin Risky But Promising Chart Setup (144.4% Potential)This chart setup is looking good but a bit risky.
Risky because we are dealing with early signals.
We have a bearish cross between EMA21 and EMA50.
A bearish cross can lead to a short-term bounce (up) but a mid-term drop (down).
We are looking to profit from this bounce.
All the levels are clearly marked on the chart.
That is support and resistance (targets) levels.
This is not financial advice.
All the information I shared is for learning and/or entertainment purposes only.
Thank you for reading.
Namaste.

