SEI | Full AnalysisHere is the top-down analysis for Sei as requested 🫡
Weekly Timeframe:
We have a potential large structure forming on the weekly chart that will be activated once we break the ATH. Its target zone lies between $1.8 and $2.2.
My sell targets for SEI this cycle are:
TP1: $0.73
TP2: $1.14
TP3: $
Related pairs

Sei short to $0.2556 todayOpened a short position on sei just now. Aiming for $0.2556
market likely to push for another low again.
Sl: $0.2808
Tp: 0.2556
Market might push up a bit more. I didn't wait for ideal confirmation but invalidation is valid.

SEI/USDT at a Critical Level Golden Pocket Reaction Will Define?🔍 Technical Analysis:
1. Market Structure:
SEI/USDT is in a recovery phase after a significant downtrend.
Price is currently testing a crucial area between the Fibonacci retracement levels of 0.5 (0.2778) and 0.618 (0.2515) — known as the Golden Pocket Zone.
2. Key Support & Resistance Levels:


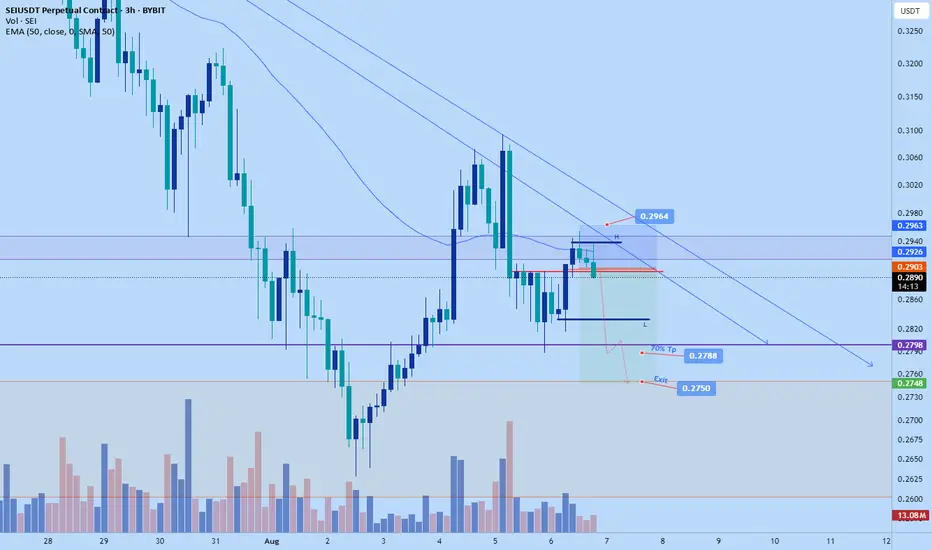
Sei short to $0.2750Just recently opened up a short position on sei. Aiming for $0.2750
Time sensitive
sl: 0.2964
SEI ANALYSIS (1D)SEI is currently moving into a channel which is providing a very specific outlook.
At the moment, it is hard to determine if the outlook is bullish or bearish in the mid term.
If we ignore BTC and the possible altcoin bull run to cut out the noise, I believe this asset is either getting ready to pu

SEI Long / Buy Intraday SetupSEI bounced well from weekly Bullish retest, Now if sei manges to close above 0.3660 on 4hrs then it can lead to 0.48 next. For now wait for the entry , take small entry on mention point and second from dca point and tp given. Don't hold any trade must use sl.

SEI $0.33 back to ath?SEI since December bearish momentum to June.
Around June the bullish momentum started.
We´re looking for NYSE:SEI to continue and break through support at $0.34.
Macd = Avg Bullish
Rsi = Avg Bullish
Stoch Rsi = Bullish
If this zone holds, the risk/reward setup favors bulls with clear upside tar

#SEI/USDT The best future belongs to this coin.#SEI
The price is moving within an ascending channel on the 1-hour frame, adhering well to it, and is on track to break it strongly upwards and retest it.
We have support from the lower boundary of the ascending channel, at 0.2967.
We have a downtrend on the RSI indicator that is about to break a

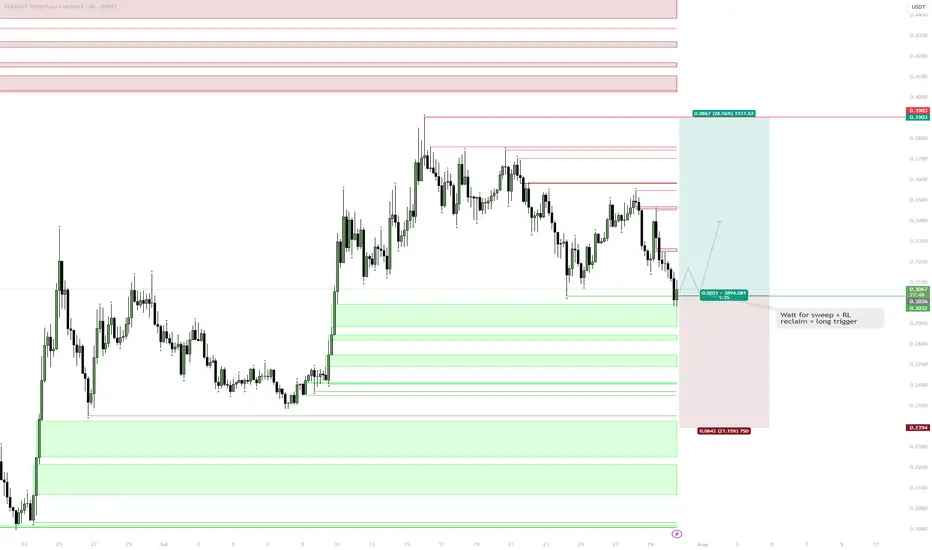
SEI | Setup: Sweep & Reclaim Scenario:Wait for a sweep of the range low (RL) into the Daily FVG (gray box).
Look for a reclaim of RL as the trigger for a long.
Reasoning:
Sweep into FVG traps late sellers and sets up liquidity for a reversal.
Reclaiming RL after the sweep signals strength and confirms a local bottom.
No need to cha
See all ideas
Summarizing what the indicators are suggesting.
Oscillators
Neutral
SellBuy
Strong sellStrong buy
Strong sellSellNeutralBuyStrong buy
Oscillators
Neutral
SellBuy
Strong sellStrong buy
Strong sellSellNeutralBuyStrong buy
Summary
Neutral
SellBuy
Strong sellStrong buy
Strong sellSellNeutralBuyStrong buy
Summary
Neutral
SellBuy
Strong sellStrong buy
Strong sellSellNeutralBuyStrong buy
Summary
Neutral
SellBuy
Strong sellStrong buy
Strong sellSellNeutralBuyStrong buy
Moving Averages
Neutral
SellBuy
Strong sellStrong buy
Strong sellSellNeutralBuyStrong buy
Moving Averages
Neutral
SellBuy
Strong sellStrong buy
Strong sellSellNeutralBuyStrong buy
Displays a symbol's price movements over previous years to identify recurring trends.
Frequently Asked Questions
The current price of SEI / TetherUS (SEI) is 0.3344 USDT — it has fallen −2.10% in the past 24 hours. Try placing this info into the context by checking out what coins are also gaining and losing at the moment and seeing SEI price chart.
SEI / TetherUS price has risen by 3.03% over the last week, its month performance shows a 15.96% increase, and as for the last year, SEI / TetherUS has increased by 14.72%. See more dynamics on SEI price chart.
Keep track of coins' changes with our Crypto Coins Heatmap.
Keep track of coins' changes with our Crypto Coins Heatmap.
SEI / TetherUS (SEI) reached its highest price on Mar 16, 2024 — it amounted to 1.1450 USDT. Find more insights on the SEI price chart.
See the list of crypto gainers and choose what best fits your strategy.
See the list of crypto gainers and choose what best fits your strategy.
SEI / TetherUS (SEI) reached the lowest price of 0.0640 USDT on Aug 15, 2023. View more SEI / TetherUS dynamics on the price chart.
See the list of crypto losers to find unexpected opportunities.
See the list of crypto losers to find unexpected opportunities.
The safest choice when buying SEI is to go to a well-known crypto exchange. Some of the popular names are Binance, Coinbase, Kraken. But you'll have to find a reliable broker and create an account first. You can trade SEI right from TradingView charts — just choose a broker and connect to your account.
Crypto markets are famous for their volatility, so one should study all the available stats before adding crypto assets to their portfolio. Very often it's technical analysis that comes in handy. We prepared technical ratings for SEI / TetherUS (SEI): today its technical analysis shows the strong buy signal, and according to the 1 week rating SEI shows the buy signal. And you'd better dig deeper and study 1 month rating too — it's neutral. Find inspiration in SEI / TetherUS trading ideas and keep track of what's moving crypto markets with our crypto news feed.
SEI / TetherUS (SEI) is just as reliable as any other crypto asset — this corner of the world market is highly volatile. Today, for instance, SEI / TetherUS is estimated as 7.36% volatile. The only thing it means is that you must prepare and examine all available information before making a decision. And if you're not sure about SEI / TetherUS, you can find more inspiration in our curated watchlists.
You can discuss SEI / TetherUS (SEI) with other users in our public chats, Minds or in the comments to Ideas.