Live trade hello friends✋️
Considering the price drop, you can now see that we are in important support and now we can take advantage of this situation and enter into a transaction with risk and capital management.
🔥Follow us for more signals🔥
*Trade safely with us*

#SEI/USDT#SEI
The price is moving within a descending channel on the 1-hour frame, adhering well to it, and is on its way to breaking it strongly upwards and retesting it.
We have a bounce from the lower boundary of the descending channel. This support is at 0.2470.
We have a downtrend on the RSI indicato

#SEI/USDT Ready to Fly? Breakout #SEI
The price is moving within a descending channel on the 1-hour frame, adhering well to it, and is on its way to breaking it strongly upwards and retesting it.
We have a bounce from the lower boundary of the descending channel. This support is at 0.3140.
We have a downtrend on the RSI indicator

Sei long before further dump Based on my analysis am anticipating a correction up tonight before continuation dump.
Stop: $0.2501
Tp: $0.2627 area
Roughly 2RR

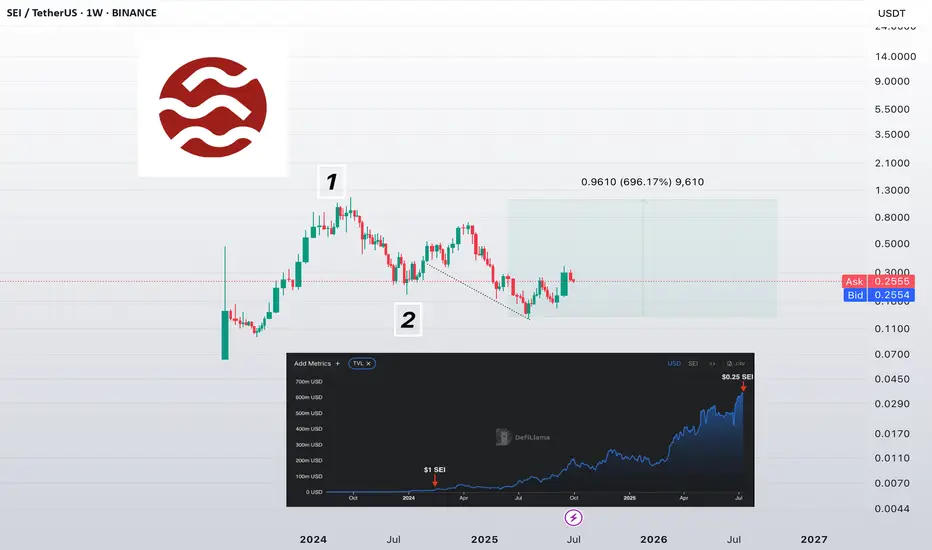
$SEI — the most underrated monster right now?
➡️ February 2024:
TVL = $13M
Price = $1
Market Cap ≈ $2.4B
➡️ Now:
TVL = $624M ❗️
Price = $0.25
Market Cap ≈ $1.4B
❓ How can you ignore these numbers? The project grew 48x in TVL, but the market cap dropped nearly 2x. Where's the logic?
If you're whining about the $0.25 price —
🔴 you're only loo
#SEI Breakout Update!#SEI Breakout Update 🚀
NYSE:SEI has broken out of its range on the 6H chart with strong momentum.
The price is now retesting the breakout zone.
If the support holds, it could move up toward $0.46 (around +36%).
Keep an eye on it! 👀

SEIUSDT Rebounds from Key Support - Pump Loading?BINANCE:SEIUSDT Rebounds from Key Support - Pump Loading?
BINANCE:SEIUSDT just touched a major support level on the 4H chart and is now showing signs of a bullish reversal after breaking above the descending trendline. This setup looks similar to previous price actions where NYSE:SEI delivered

Sei big dump to $0.23Opened a short on sei a while ago. Aiming for $0.23 based on my DTT strategy.
Stop: $0.2601
Exit: $0.23 area
Roughly 3.75 RR if plays out.

SEI/USDT Ready to Fly? Breakout from Accumulation Zone Signals🧠 Market Overview:
SEI/USDT has just delivered a powerful technical signal — a clean breakout from a major accumulation zone that has been holding price action for several months. With increasing volume and bullish price structure, this breakout could mark the beginning of a sustained upward trend.

Buy Trade Strategy for SEI: Backing High-Performance Layer 1 Description:
This trading idea highlights SEI, a purpose-built Layer 1 blockchain optimized for trading and decentralized finance applications. SEI stands out in the crowded blockchain space thanks to its high throughput, low latency, and parallelized transaction processing, which are essential for

See all ideas
Summarizing what the indicators are suggesting.
Oscillators
Neutral
SellBuy
Strong sellStrong buy
Strong sellSellNeutralBuyStrong buy
Oscillators
Neutral
SellBuy
Strong sellStrong buy
Strong sellSellNeutralBuyStrong buy
Summary
Neutral
SellBuy
Strong sellStrong buy
Strong sellSellNeutralBuyStrong buy
Summary
Neutral
SellBuy
Strong sellStrong buy
Strong sellSellNeutralBuyStrong buy
Summary
Neutral
SellBuy
Strong sellStrong buy
Strong sellSellNeutralBuyStrong buy
Moving Averages
Neutral
SellBuy
Strong sellStrong buy
Strong sellSellNeutralBuyStrong buy
Moving Averages
Neutral
SellBuy
Strong sellStrong buy
Strong sellSellNeutralBuyStrong buy
Displays a symbol's price movements over previous years to identify recurring trends.