TradeCityPro | SEI: Tracing the Ascending Trend Lines👋 Welcome to TradeCityPro! In this analysis, I'm going to delve into the SEI coin, with an examination across weekly, daily, and 4-hour timeframes.
📅 Weekly Timeframe: Approaching the Ascending Trend Line
In the weekly timeframe, we are witnessing a strong upward trend that has moved up to 0.9856, then retraced to the support at 0.2477, forming an ascending trend line. Currently, after reaching a high of 0.6957, it has pulled back to this trend line.
📊 The market volume is currently in favor of buyers and the upward trend, with the price maintaining a bullish nature. If it breaks and consolidates above the resistance at 0.9856, a significant upward momentum will enter the market, likely pushing the price to set new ATHs.
🚀 For higher targets for a new ATH, it's best to wait until the price first breaks the ceiling of 0.9856 and then determine the significant ranges based on the corrections made.
📉 If the trend line breaks, the first trigger for a potential breakdown would be at 0.3423, considered a risky trigger in this timeframe, and the main downtrend will begin after breaking 0.2477. This could even lead the price to drop as low as 0.1026.
📅 Daily Timeframe: Ready to Move
In this timeframe, as seen, the price has reacted to the weekly trend line, piercing through it in today’s candle and rising from the support at 0.3642. This area is a significant support level and has previously seen a robust upward trend to 0.7082 after a fake breakout.
🧩 Currently, the volume of the last bearish leg is decreasing, and with the appropriate bullish momentum entering, the price could be supported again from this area. The first trigger for a breakout would be 0.4714, and breaking the 50 in the RSI would confirm the entry of bullish momentum.
📉 If the trend line and the 0.3642 support break, bearish momentum could enter the market, potentially driving the price towards the 0.2615 support. Since the selling volume is decreasing, it’s challenging to determine a definite bearish target, so it’s better to wait for a clear bearish momentum to see how low the price could go after breaking 0.3642.
⏳ 4-Hour Timeframe: Futures Triggers This timeframe shows a descending channel that isn’t very clean, with the price having already made a fake breakout at the bottom. Currently, the price hasn’t reached the top of the box and is pulling back to the mid-line of the channel after reaching the box’s bottom again.
✨ For short positions, there appears to be more momentum in the market, and the trigger for this position is at 0.3697. However, this support isn’t precisely determined yet, so it's better to wait for the price to reach this area again and react before setting a new definite support level. The next trigger would be at 0.3365, with a break of 30 in the RSI serving as a good confirmation.
📈 For long positions, it’s advisable to wait until the price breaks the channel and bullish momentum enters the market. The first trigger for a long position would be breaking the resistance at 0.4738. However, if you wish to take a riskier position within the channel, breaking the trigger at 0.4233 could be appropriate.
📝 Final Thoughts
This analysis reflects our opinions and is not financial advice.
Share your thoughts in the comments, and don’t forget to share this analysis with your friends! ❤️
SEIUSDT trade ideas

SEI/USDTIt has a very good potential in the medium-term. I will consider buying.
Long position zones:
0.37 - 0.35
0.32 - 0.30
Targets for updating the local high.

#SEI/USDT Analysis#SEI has swept PML $0.3713 and PWL $0.3664 and broken the Diagonal Trendline.
💡 Strategy:
Wait for a retracement to tap the 4H FVG before considering a long position.
🔍 Key Levels:
Resistance: PWH $0.4788

SEI/USDT: Bullish Butterfly in Play – Will This Support Hold ?Yello, Paradisers! Are you keeping a close eye on #SEIUSDT? This pair has been quietly forming a Bullish Butterfly pattern, and we’re sitting right on the critical D leg support. But remember, it’s not all sunshine – there are some key resistance levels ahead, and the market isn’t always forgiving if you lose focus.
💎#SEIUSDT has completed the XABCD leg structure of the Butterfly pattern perfectly, and we’re now resting on the D leg, a crucial support zone. On higher timeframes, this level has held strong, suggesting a probable potential bullish bounce from here.
💎The Major Support Zone is around 0.3328.This level aligns with the X leg of the Bullish Butterfly pattern. It’s a critical price floor, and as long as SEIUSDT stays above it, bulls have a strong probability to regain control and push prices upward.
💎SEIUSDT is currently sitting on the D leg of the pattern, which is acting as a secondary support. This level has already shown strength on higher timeframes, giving bullish momentum a chance to sustain from here.
💎The first minor resistance zone is coming up soon. Watch for a candle close above this level to confirm bullish continuation.If SEIUSDT clears that, the next resistance is at 0.5934 to 0.6126, followed by a stronger zone between 0.7120 to 0.7364.These levels could offer significant opportunities for bulls, but they won’t be easy to break through without strong volume.
💎The pattern invalidates if the price closes below the X leg at 0.3328.If that happens, it’s a warning sign that the bullish structure has failed, and a deeper retracement could follow.
💎Stay disciplined, Paradisers. The Bullish Butterfly pattern is a promising setup, but patience is key. Watch how SEIUSDT behaves at the upcoming resistance zones, and wait for confirmations before making moves.
Trading isn’t about chasing every pump – it’s about positioning yourself where the probabilities are in your favor. Let’s trade smart and avoid getting caught on the wrong side of the market.Play it safe, Paradisers. The market rewards patience and discipline. Focus on the bigger picture, and you’ll stay ahead of 90% of traders out there.
MyCryptoParadise
iFeel the success🌴

sei possible setupSuiusdt range setup. After deviation is completed, I will look for a msb to enter the long position. My target will be OB area of 1D

SEI No more, just Hodl I scooped up SEI at $0.40 - $0.42.
If the market yeets back down from $0.47 - $0.49 (short hedge vibes) and we see those juicy $0.38 lows, I’m ready to stack more bags. 🚀
But if SEI decides to send it now, I’m laser-focused on the moon map:
Target 1: $0.65 (warm-up)
Target 2: $1.90 (serious gains)
Target 3: $3.90 (full degen mode, let’s gooo!)
COINBASE:SEIUSD
This could take a while… if it even happens. But you know what? I believe in SEI. 🐶💎
FYI: I make these charts for my own vibes, education, and entertainment. Do what you want with them—no financial advice here, fren. 🌕

#SEI/USDT Ready to go higher#SEI
The price is moving in a descending channel on the 15-minute frame and sticking to it well
We have a bounce from the lower limit of the descending channel, this support is at 0.3900
We have a downtrend on the RSI indicator that is about to be broken, which supports the rise
We have a trend to stabilize above the 100 moving average
Entry price 0.4017
First target 0.4133
Second target 0.4257
Third target 0.4413

SUIUSDTlong term bullish on this due to a variety of confluences and fundamental factors.
tidy chart.

SEI - Ascending Triangle FormingSei is currently forming an ascending triangle. If price revisits our lowertrendline look for longs or if price breaks above our top horizontal line look for longs on a retest. Our fib extension target is around $0.555 and our measured move price target sits around $0.62.

SEI expected movement in the coming daysBINANCE:SEIUSDT
✅ The SEI currency is fluctuating on the bottom of its medium-term ascending channel on the daily timeframe and, with the break of the 0.486 resistance, it could move towards the following targets in the short term:
0.55, 0.61, 73
✅ SEI Major Demand Range is currently $0.38 to $0.40 👌
⚠️ Disclaimer:
This is not financial advice. Always manage your risks and trade responsibly.
👉 Follow me for daily updates,
💬 Comment and like to share your thoughts,
📌 And check the link in my bio for even more resources!
Let’s navigate the markets together—join the journey today! 💹✨

Cycle of SeiIf the wedge will break up an uptrend can start as long as "ab" from the point of break.
5 waves elliot cycle. My long term plan. Who knows, maybe we'll see a supercycle in shorter time period?
* What i share here is not an investment advice. Please do your own research before investing in any digital asset.
* Never take my personal opinions as investment advice, you may lose all your money.

#SEI. Profitable Trade Opportunity. 02/06/25BINANCE:SEIUSDT It’s worth considering entering a position since there’s currently an opportunity for a profitable trade.
At the moment, the asset price has approached the structure's resistance level, and further price movement will depend on its reaction to this price range.
Personally, I’d recommend considering an entry in case of a correction within the range of $0.4380 - $0.3638, with a target of $0.7316 - $0.9336. You can also take a small position from the current levels, using a small percentage of your total spot deposit.
DYOR.

SEI/usdtSEI market will bear the the paw of the bear this upcoming week🧸 draining liquidity to 20cents before a up swing

#SEI Ascending Triangle Breakout (High Risky Setup)#SEIUSDT is forming an ascending triangle pattern, a bullish continuation pattern. Enter long at the breakout above resistance, with a stop loss below the recent swing low. Set a take profit based on a favorable risk reward ratio. Monitor volume and practice proper risk management.

#SEI/USDT Ready to go higher#SEI
The price is moving in a descending channel on the 1-hour frame and sticking to it well
We have a bounce from the lower limit of the descending channel, this support is at a price of .4060
We have a downtrend on the RSI indicator that is about to be broken, which supports the rise
We have a trend to stabilize above the 100 moving average
Entry price 0.4214
First target 0.4330
Second target 0.4500
Third target 0.4674

SEI/USDT Wave 3 Breakout – Targeting $2.154!SEI has likely bottomed out after consolidating near its key support zone and is now displaying strong bullish momentum, signaling the start of Wave 3.
🔑 Key Insights:
📊 Daily Bullish Divergence: Momentum indicators reveal a bullish divergence on the daily timeframe, supporting a potential trend reversal and breakout to the upside.
📈 Daily MA200 at $0.40: The $0.40 level, aligning with the daily MA200, has acted as a strong confluence zone and a critical support level for SEI.
🔄 Accumulation Phase: SEI has been consolidating near this area, and the recent breakout signals the end of this phase.
🎯 Wave 3 Target:
Minimum Target: 🎯 2.14
Wave 3, typically the most extended and impulsive move in Elliott Wave Theory, aligns with the 2.618 Fibonacci extension, reinforcing the bullish outlook.
🛠 Support Levels:
📌 Key Support Zone: $0.40
In case of a pullback, this level will be critical for a potential retest and further accumulation.
📊 Conclusion:
SEI’s bullish divergence, strong confluence at $0.40, and breakout suggest a promising upward trend. With Wave 3 targeting $2.154, traders should monitor for sustained volume and positive market sentiment to confirm this momentum.
Disclaimer:
⚠️ This analysis is for educational purposes only and not financial advice. Always conduct your own research and trade responsibly.

SEi's Points of Interest.SEi 1d
Price is currently sitting on the ma200 acting as support, it is also in the flip zone where price had a multiple reactions. 5 wave count marking the start from the lowest low, it is now down by 45% from the last swing high. MA100 + bullish OB on the breakout of wave3 fails to hold as support and in turn become a breaker/resistance when price made a turn upwards. Connected swing lows to form the trendline support. Possible scenarios would be:
1. Inducement taken out around 0.37, fill small gaps & mitigate demand zone of wave 4.
2. Raid wave 4 lows, fill gaps and mitigate demand zone of wave 2.
3. Bounce on the ma200+trendline support


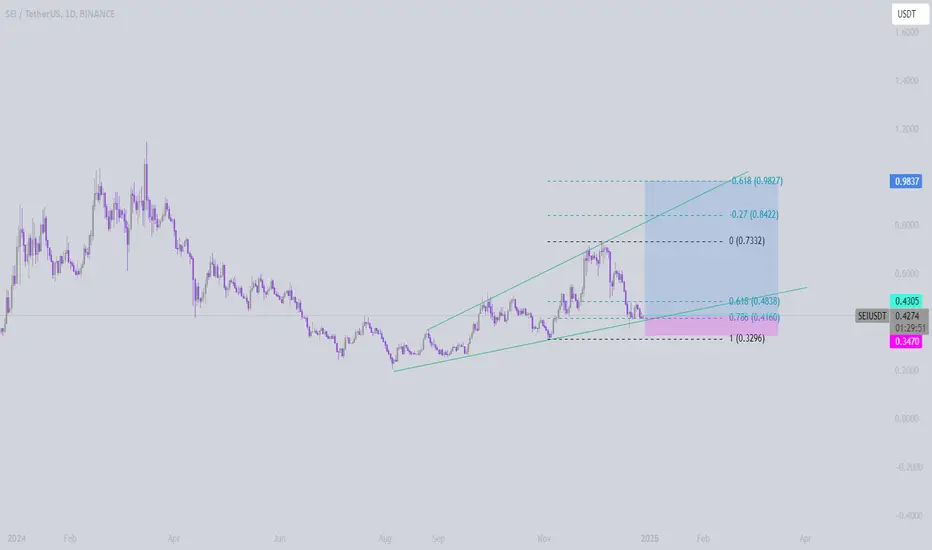
Bullish Channel Setup with Two Key Scenarios | $SEITECHNICAL ANALYSIS: 🎯
Price Structure:
- SEI is currently trading within a well-defined ascending channel (marked by orange lines)
- Current price: $0.4156 (-2.49%)
- Strong demand zone established between $0.28-0.35 acting as key support
Two Potential Scenarios for Q1 2025:
Scenario A (Purple Path):
- Immediate bounce from current levels
- Series of higher highs and higher lows
- Price target: $0.85-0.90 by March 2025
- Key resistance levels to watch: $0.55, $0.65, $0.75
Scenario B (Light Blue Path):
- Initial retest of demand zone ($0.30-0.35)
- Sharp V-shaped recovery
- Same ultimate target: $0.85-0.90
- Higher risk-reward ratio if demand zone holds
Key Levels to Watch:
▪️ Major Support: $0.35 (Top of demand zone)
▪️ Current Channel Support: $0.41
▪️ Channel Resistance: $0.52
Risk Management:
- Stop Loss: Below demand zone ($0.28)
- Position scaling opportunities at demand zone retest
- Channel breaks should be monitored for validation/invalidation
Timeframe: Daily
Bias: Bullish with caution
Pattern: Ascending Channel
Note: This is technical analysis only. Always DYOR and manage your risk accordingly. Not financial advice.
#SEI #Crypto #TechnicalAnalysis #Binance

SEI ON THE VERGE OF…If 0.40$ is held and we see bullish candles we wait for 1$
The price can also reach 0.34$, then the head and shoulders pattern will be confirmed. then we will see an attempt for breaking the shoulder at 0.50$. It fails and we wait for 0.20$, breaks it and again we HODL until 1$.

SEI BUY...hello friends
Considering the support range we are in, we expect a short-term growth from this currency.
Be sure to observe capital management.
Be successful and profitable.

Sei/usdt longAlmost every altcoin has pull backed at least 45%.
Sei looks good.
LOng and strong.
Soon dominance will start its downtrend.
Golden Cross 4H 1D🚨🚨🚨 NOT FINANCIAL ADVICE 🚨⚠️
Just noticed a golden cross appear on both the 4H and 1D charts for NYSE:SEI as much as it's been dragging rear the last bit we need to read between the lines here. The RSI, The moving averages, the sideways price movement.
Previously discussed idea of a big bounce back from correction is becoming more and more viable by the day. Now with GC appearing on the 4hr and 1D I'm so pumped
Whose coming ?
SEI enter between $0.43-$0.44250
No more then 10x if leveraged (preference goes to spot if your not a seasoned futures trader)
TP: $0.55
TP2: $0.60
TP 3: 0.63
Longer term
TP: $0.65
TP2: $0.75
TP3: $0.82
TP for new investors or scalping is $0.55
You could also do a trailling TP at the three levels
Again not financial advice of any kind do your own research.
