SEI short updated (entry found)This is an update to my previous publication (SEI SHORT IDEA), now as I see the price displacing on the 15min chart I have set my entry on the most recent disp FVG which makes an reasonble entry for me, we could also be using the larger one bit higher but that one might not get tapped.
SEIUSDT trade ideas

SEI short updated (entry found)This is an update to my previous publication (SEI SHORT IDEA), now as I see the price displacing on the 15min chart I have set my entry on the most recent disp FVG which makes an reasonble entry for me, we could also be using the larger one bit higher but that one might not get tapped.

SEI short ideaEven the overall sentiment is bullish I would go for a short position entering somewhere at 0.71 and aiming for the lows beneath along the way to the nice daily fvg that we can see on the chart, from there I expect the price to move up again.
But I would personally wait for some price development because for me there is no clear entry for now just prediction and speculation, so I will wait until I can see some displacement towards the lows and enter based of of the displacement ideally paired with some lq sweep before that and mss, a+++ setup would be if we could se it reacting agressively to the ob- order blocks that can be seen on 4h 1h and 30m timeframes.
Always DYOR and do not overleverage as it mainly leads to financial loss.

#SEI Looking at a higher time frame NYSE:SEI has been inside a good accumulation range, watching for a retracement into our green zone for an entry.
Again this is a higher time frame chart don't ape more than 5%

SEI Possible Retracement to Local HighA retracement needed to the OB.
I am an amateur trader. I sometimes enter into trades. Other times it is only an analysis. Trade with your own risk awareness.

SEI - Picture Perfect Prediction
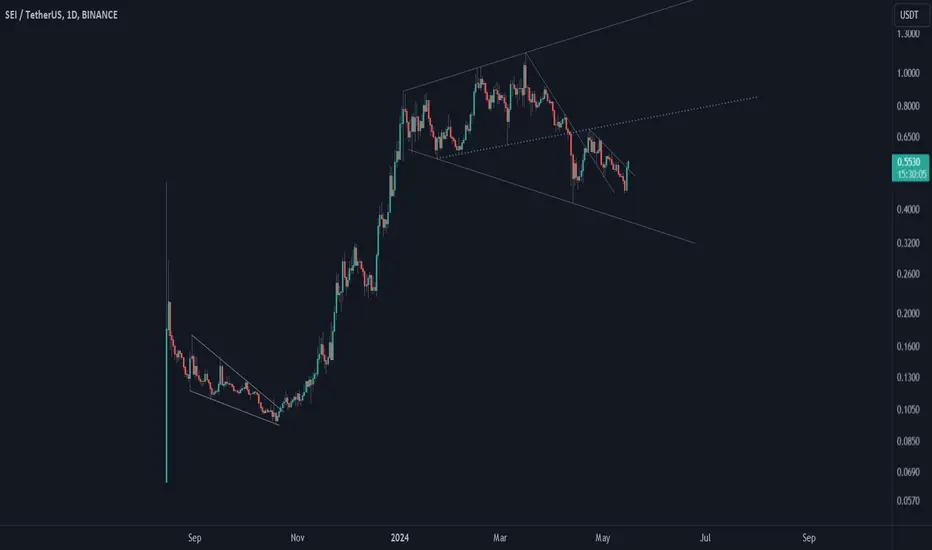
Looking at our last post, we identified SEI broke down and retested its triangle as new resistance. Since that retest SEI dropped 28% to the pivotal $0.50 level. The technical breakdown target was $0.44 but since we saw so much liquidity get absorbed at $0.50 that might've been the low.
One of the other things I'm watching for is for SEI to continue to close above our white trendline. This trendline is from a previous SEI chart and is very significant. If we can continue to close 4H candles above this white trendline ($0.56-$0.57) then we should see the uptrend resume.

SEI BTC vs SEI USDTAs we see on the chart,
SEI USDT has broke the consolidation area (as seen better on the Daily Chart)
I'll long SEI USDT with trigger of SEI BTC Breakout.

SEI - Short Term BreakdownSEI also has broken down from the pattern we have been monitoring. Will update buying opportunities once the breakdown is complete.

#SEI/USDT Ready to go higher#SEI
The price is moving in a descending channel on the 1-hour frame and sticking to it well
We have a bounce from the lower limit of the descending channel, this support is at 0.6600
We have a downtrend on the RSI indicator that is about to be broken, which supports the rise
We have a trend to stabilize above the moving average 100
Entry price 0.6636
First target 0.6870
Second target 0.7135
Third target 0.7439


SEI swing / position tradeHere is my idea of a long term (weeks to months) sei trade
I would use leverage from 2-5x depending on the capital, entering at 0,5934 because I expect the price to tap into that region once more, displacement fvg on the daily and a order block along with fib level aligns there nicely so that makes up for a nice confluence for me to take that as an valid long entry. I would take partial profits along the way on the fib levels.
I am open to criticism and as always DYOR and do not overleverage.

Calculated levels posible targets for SeiHere are the possible next targets for Sei based on the calculated levels.

Sei Long to .91-$1.00Just opened a sei/usdt position. Hoping to benefit from altseason pump.
I think this is a good key area of interest for entry and stoploss is quite generous giving it enough room to play.
See partial targets on chart

SEI on a breakout path! We're seeing a strong move above previous resistance, heading towards ATH (all-time high). Price has broken out of a long-term descending trendline, found support, and is showing an impressive 173% gain.
Key levels to watch:
Support at $0.39
Resistance around $1.07
Momentum is picking up, and this could be a sign of more upside to come if we maintain above these levels. Bulls are definitely back in the game!

TradeCityPro | SEI : Bullish Momentum with Key Resistance👋 Welcome to TradeCityPro!
In this analysis, we’ll evaluate the performance of SEI, a blockchain designed for decentralized futures trading. For a deeper understanding of the project, you can review its whitepaper.
⏳ Daily Timeframe: High Buying Volume and Uptrend
The daily chart shows a bullish trend supported by a trendline that has been tested three times. Currently, the price is well above this trendline. As long as the price remains above it, the overall trend will stay bullish.
📈 A breakout above $0.6944 could push the price to the next target of $0.9733. Beyond this resistance, SEI may aim for new All-Time Highs (ATH).
🔑 RSI entering the Overbought Zone (above 70) could trigger a sharp upward move.
🔽 In a bearish scenario, the price could correct to $0.5284 initially. A deeper correction might bring it down to the trendline and the $0.4006 support level.
📊 Currently, buying volume exceeds selling pressure, indicating that a correction is unlikely unless significant selling pressure enters the market.
⏳ 4-Hour Timeframe: Futures Triggers
In this timeframe, we’ll focus on identifying potential futures trading triggers:
🔼 For long positions, a breakout above the $0.6944 resistance, especially with increasing buying volume, would be ideal. If RSI also breaks the 50 level, the likelihood of overcoming this resistance increases.
📉 For short positions, a break below the $0.596 level could act as a trigger. However, personally, I avoid shorting as long as the price remains above the daily trendline.
📝 Final Thoughts
This analysis reflects our opinions and is not financial advice.
Share your thoughts in the comments, and don’t forget to share this analysis with your friends! ❤️

SEIUSDT Elliott Waves (Local Setup)Hello friends.
Please support my work by clicking the LIKE button👍(If you liked).
Everything on the chart.
Entry zone: market and lower
Target zone: 0.55 - 0.6
after first target reached move ur stop to breakeven
Stop: 0.31 (depending of ur risk).
ALWAYS follow ur RM
risk is justified
It's not financial advice.
DYOR!

SEIThe SEI Network is a Cosmos-based Layer 1 blockchain that specializes in trading infrastructure for decentralized exchanges and marketplaces. SEI accelerates blockchain efficiency and block finality, reducing it to a mere 380 milliseconds through the twin-turbo consensus mechanism.
Anyway, it is clear that SEI has potential. Besides the beginning in which SEI was in a descending triangular shaped pattern, SEI went up pretty well—almost 1000%. Then correction started that seems unfolding in an inverted wedge pattern. SEI broke both the minor downtrend line going toward the wedge's middle line (blue). If SEI can break this line, reaching the wedge's upper line is possible. Let's see what happens.
#SEI/USDT#SEI
The price is moving in a descending channel on the 1-hour frame upwards and is expected to continue
We have a trend to stabilize above the moving average 100 again
We have a downtrend on the RSI indicator that supports the rise by breaking it upwards
We have a support area at the lower limit of the channel at a price of
0.6380
Entry price 0.6650
First target 0.6968
Second target 0.7247
Third target 0.7600

#sei 1dOn the 1-hour timeframe, the currency is forming a neutral triangle.
Considering the end of wave C, it is suitable for holding.


SEI is going HigherI am confident in trading this one. The price has broken the resistance at 0.6 and is consolidating above it. I believe it is heading higher as part of wave 3. By the end of this year, we might see SEI reach 1 dollar.

SEIUSDT Analysis: Key Levels to Watch for the Next Bullish MoveYello, Paradisers! Is SEIUSDT on the brink of a major major move , or should we brace for a retracement? Let’s dive into the latest technical setup, which could signal a big move ahead.
💎#SEIUSDT is currently positioned within a probable support zone, showing signs of potential bullish momentum with recent strong green candles. If this momentum holds, it could aim for a move above the key resistance level, presenting an opportunity for buyers.
💎If SEIUSDT sustains its upward momentum, it stands a solid chance of targeting levels above the critical resistance zone, especially following the recent break above $0.4197. Look for a retest of this level, where resistance could now act as support an ideal entry point with strong confirmation.
💎But what if the momentum slows? If SEI loses strength and falls below $0.4197, this would indicate waning bullish power, opening up potential for a bearish shift.
💎In this case, watch the lower demand zone at $0.3396, which has historically held firm for buyers. A rebound here could reinforce the bullish outlook, but a drop below $0.3396 could invalidate this setup, signaling a potential trend shift toward bearish sentiment.
As always, patience and discipline are crucial here. Wait for confirmation at critical levels before making any moves. Stay focused and trade smart, Paradisers. Only those who follow the cycles with discipline will reap the rewards in the long run!
MyCryptoParadise
iFeel the success🌴

SEI tends to growAccording to the analysis based on the Fibonacci sequence, BINANCE:SEIUSDT aims to reach 1.618 in the short term and 1.272 in the medium term. Today's token unlocking is expected to have a positive impact on the market value of the asset. My observations of the blockchain data indicate that investment funds are approaching the critical threshold of owning an issue of the asset. I expect the 0.54-0.56 area in the near term.
Best wishes, Horban Brothers!
