#SEI/USDT#SEI
We have a bearish channel pattern on a 4-hour frame, the price moves within it and adheres to its limits well
We have a green support area at 0.5025 after the price touched it and bounced from it
We have a tendency to stabilize above moving average 100
We have an uptrend on the RSI indicator that supports the price higher
Entry price is 0.5025
The first goal: 0.5332
The second goal is 0.5629
The third goal is 0.5948
SEIUSDT trade ideas

#SEI Trading IdeaSEI/USD formed a potential Falling Wedge pattern. Probability to see a pump after a clean breakout. My next potential target would be that Red/Golden Zone around $0.7812.

#SEI/USDT#SEI
We have a bearish channel pattern on a 1-hour frame, the price moves within it and adheres to its limits well, and it is about to break upwards.
We have a green support area at 0.3000
We have a tendency to stabilize above moving average 100
We have a downtrend on the RSI indicator that supports the price higher
Entry price is 0.5700
The first target is 0.6000
The second target is 0.6370
The third target is 0.6860

$SEIreclaim 5378 or we may just sweep 59K on corn and the lower range of this
above the 200 ema on the daily
targeting range high 50%

SEI Trade planSEI is acually stuck under main trendline and under resistance zone. I think it can be a good long trade but only if we can see a strong upside move that will break above main trendline and support zone, then we can expect a retrace to the support zone again and a range before pump again till the resistance zone at $0.87-$0.9. That's the plan, i will look for an entries if given

Trade Idea for SEI Network (SEI) - Accumulation StrategySEI Network (SEI) is showing promising potential as a fast Layer 1 blockchain, particularly noted for its trading-focused capabilities. As of the latest data, SEI is priced around $0.54, following a notable price surge attributed to its v2 upgrade and heightened activity around SEI-based memecoins.
Consider initiating a position at the current market price of $0.54. This price marks a recent rally point and could serve as a strong foundation for an accumulation strategy.
Should the price experience pullbacks, additional purchases could be considered at lower levels to average down the cost. Key levels for additional buys could be strategically placed if the price drops to $0.40 or lower, capitalizing on market corrections while maintaining exposure to potential upswings.
The strategy involves setting multiple sell targets to capture profits during price ascensions. The initial sell target is set at $0.96, with subsequent targets at $1.04, $1.40, $1.60, and $1.80. These targets are chosen to align with psychological price points that may act as resistance levels during upward movements.
SEI's recent surge can be attributed to speculative interests and the anticipated utility increase following its version 2 upgrade, expected in the first half of 2024. Such factors often attract increased trading activity, which can lead to significant price movements.
This strategy reflects a higher risk tolerance, suited for investors who can afford to hold through potential volatility without the safeguard of a stop loss. This approach is typical for those with a deeper understanding of the project’s fundamentals and a long-term bullish outlook.
SEI Network's strategic developments and enhancements in its blockchain capabilities provide a robust foundation for potential growth. The phased buying approach allows investors to benefit from both short-term price spikes and long-term appreciation as the network's adoption and functionality expand.
This trade idea is based on the latest available market data and SEI Network’s development trajectory as of May 2024. Please consider this analysis as part of your broader research. Cryptocurrency investments carry inherent risks, including the loss of principal. This information is not financial advice.

Here's the rationale for the SEI to riseHi, guys. Nice to meet you
I hope today will be a day full of joy
It's creating conditions for a rise by adjustment as extended waves.
If the upper line of the extended wave is broken upward, candle can rise to the purple long-term uptrend line.
If chart ignore the upward conditions of the extended wave and fall down, Green and red lines are likely to be support line.
(There should be absolutely no way to break down the red long-term downtrend line.)

Keeping an eye on #SEI/USDT Diagonal Trendline in 1-Hour TF!Keeping an eye on #SEI/USDT Diagonal Trendline in 1-Hour TF!
TSXV:SEI needs to hold this trendline. In case of Breakdown open a short position. The next local support level is PWL $0.546


trade in break ;iquidity level📊Analysis by AhmadArz:
🔗"Uncover new opportunities in the world of cryptocurrencies with AhmadArz.
💡Join us on TradingView and expand your investment knowledge with our five years of experience in financial markets."
🚀Please boost and💬 comment to share your thoughts with us!

SEI Short setupSEI in downtrend on HTF
Be patient for entry and short from bearish OB above above LTF
Follow for more market update and trade setup

SEI Holders! FOLLOW ME~!Good day, guys.
This is ESS team.
Let's check the SEIUSDT chart.
If it strongly breakthrough the GREEN downtrend line, It may try to breakthrough the RED long-term downtrend line.
Even if it fail, It will reach the top of the uptrend line after breaking through the red long-term downtrend line with buy-power at uptrendline.

SEIUSDT.P Low TF long and short zonesLooking to short SEI from 0.8351 - 0.8696 if we get a low tf bearish rsi divergence ( 5, 15, 30 min)
Looking to long SEI from 0.4912 - 0.4737 if we get a low tf bullish rsi divergence ( 5, 15, 30 min)
SL is manual if DIV is broken.
Enter only if we get a DIV.

SEI Wave C SetupWe experienced a three-wave ABC rally to the February high, appearing as wave A, followed by a three-wave pullback in wave B that reached the 0.382 Fibonacci level. We now anticipate wave C to rise, with a target price of $4.55, as A=C. There is a consideration of starting scaling into support with the expectation of a dip to the 0.5 Fibonacci level, and scaling out at resistance.

SEI/USDT - Sei Network: TrendLine Breakout◳◱ On the $SEI/ CRYPTOCAP:USDT chart, the Trendline Breakout pattern suggests an upcoming trend shift. Traders might observe resistance around 0.6479 | 0.7077 | 0.8636 and support near 0.492 | 0.3959 | 0.24. Entering trades at 0.6348 could be strategic, aiming for the next resistance level.
◰◲ General info :
▣ Name: Sei Network
▣ Rank: 66
▣ Exchanges: Binance, Kucoin, Bybit, Huobipro, Gateio, Mexc
▣ Category/Sector: N/A
▣ Overview: Sei Network project overview is currently unavailable. I'll try to update this in the upcoming analysis.
◰◲ Technical Metrics :
▣ Mrkt Price: 0.6348 ₮
▣ 24HVol: 35,535,267.898 ₮
▣ 24H Chng: 4.735%
▣ 7-Days Chng: 27.82%
▣ 1-Month Chng: -21.06%
▣ 3-Months Chng: -1.52%
◲◰ Pivot Points - Levels :
◥ Resistance: 0.6479 | 0.7077 | 0.8636
◢ Support: 0.492 | 0.3959 | 0.24
◱◳ Indicators recommendation :
▣ Oscillators: NEUTRAL
▣ Moving Averages: STRONG_BUY
◰◲ Technical Indicators Summary : BUY
◲◰ Sharpe Ratios :
▣ Last 30D: -2.86
▣ Last 90D: 0.29
▣ Last 1-Y: 1.92
▣ Last 3-Y: 1.92
◲◰ Volatility :
▣ Last 30D: 1.09
▣ Last 90D: 1.22
▣ Last 1-Y: 1.40
▣ Last 3-Y: 1.40
◳◰ Market Sentiment Index :
▣ News sentiment score is N/A
▣ Twitter sentiment score is N/A
▣ Reddit sentiment score is N/A
▣ In-depth SEIUSDT technical analysis on Tradingview TA page
▣ What do you think of this analysis? Share your insights and let's discuss in the comments below. Your like, follow and support would be greatly appreciated!
◲ Disclaimer
Please note that the information and publications provided are for informational purposes only and should not be construed as financial, investment, trading, or any other type of advice or recommendation. We encourage you to conduct your own research and consult with a qualified professional before making any financial decisions. The use of the information provided is solely at your own risk.
▣ Welcome to the home of charting big: TradingView
Benefit from a ton of financial analysis features, instruments and data. Have a look around, and if you do choose to go with an upgraded plan, you'll get up to $30.
Discover it here - affiliate link -

Sei chartSei key levels for support and resistance. This is done using an experimental method. This is not financial advice

updated Sei chartSei looks like an enormous upside here at this key zone. I have updated a new daily fib retracement. The next downside target is 39 cents but altcoins might stabilize here. Little nibbles around current price seem like a great opportunity. Averaging down to 39 cents could result in at least a 10 bagger over this cycle imo.
SEI USDT fri 12 apr '24 20:30! fri 12 apr '24 20:30! fri 12 apr '24 20:30! fri 12 apr '24 20:30! fri 12 apr '24 20:30! fri 12 apr '24 20:30! fri 12 apr '24 20:30! fri 12 apr '24 20:30! fri 12 apr '24 20:30! fri 12 apr '24 20:30! fri 12 apr '24 20:30! fri 12 apr '24 20:30! fri 12 apr '24 20:30! fri 12 apr '24 20:30! fri 12 apr '24 20:30! fri 12 apr '24 20:30! fri 12 apr '24 20:30! fri 12 apr '24 20:30!

SEI/USDT need to bounce from here for try break the resistance.💎 Paradisers, the recent market dynamics surrounding #SEI have indeed been noteworthy.
💎 Experiencing rejection at the resistance area and retracing back to the support, SEI now requires a bounce to attempt another breakout above resistance.
💎 Success in breaking this resistance could pave the way for a bullish reversal, potentially leading to the attainment of our target area.
💎 However, should SEI fail to find support at the current level, resulting in a breakdown below the support area, the next likely target would be the demand area.
💎 The demand zone holds significant importance as SEI needs to bounce from it and reclaim the price above the support level of 0.464 to sustain upward momentum. Failure to achieve this could result in SEI continuing its downward trajectory.
MyCryptoParadise
iFeel the success🌴

Sei nadaSei looks really strong despite the lack of momentum, could hold the all time high level.
Daily Bullish Breaker, with algo targets yet to mitigate around 1.2$.. I'm testing a new channel method.
NFA

SEIUSDT (Intraday Short Opportunity)SEI break it's 6months old trendline support and price action is suggesting selling pressure which has to be released. currently, SEI is trading at $0.815 or stop zone is $0.988 and we are targeting the support of Ascending boarding wedge pattern support which is at $0.59-$0.60.
thank you for reading.

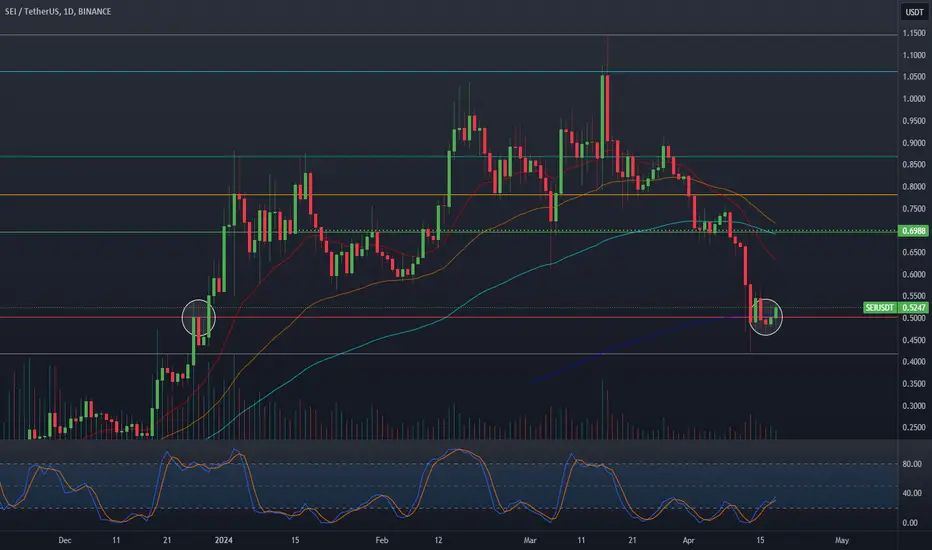
SEIUSDT 1D#SEI is bouncing from the support zone and MA200 on the daily timeframe. If it keeps the support zone, it can go up. Otherwise, it will retest the $0.5027 level. Targets are:
$0.6265
$0.7256
$0.8057
$0.8857
$0.9998
$1.1450
Use tight stop-loss.

SEI Broadening Formation, Right Angled and AscendingSEI ANALYSIS
Sei has previously benefited from the parallelization narratives being a first mover.
Broadening Formations, Right Angled and Ascending
Play as it is, wait for breakdown confirmation or play the range
Cosmos ecosystem has been a downtrend or sideways in the last month
