Sei short to $0.2161Recently entered a short position on sei. Its still good enough to get decent RR.
Expecting the market to fall back down this weekly before any further pump. The pump yesterday likely was the top of the move for the week for now and market seems more likely now to fall back lower to retest $0.2072 area to hopefully find strong enough demand to get a more sustainable pump
SEIUSDT trade ideas

Sei longJust now opened up a long position on Sei.
Targeting $0.2316 area
Stop: $0.2192 or lower
Roughly 2RR trade.
Trend is currently bearish on 4hr tf. Anticipating that this move will continue pushing to the upside flipping the 4hr tf bullish around $0.2316

SEIUSDT LONG 1DBullish Trend
Entry on Trendline
Expecting bullish trend will continue
AB==CD extra confirmation


SEI LIVE TRADEHello friends
Given the decline we had, we expect to experience another decline and we can open a trade in the direction of the trend with capital and risk management.
*Trade safely with us*

Sei long term.I expect it to reach 0.18 levels in the coming period, but before that, prices may approach 0.26 again. I expect the 3rd elliot wave to start between approximately 0.18 0.16 region.
* The purpose of my graphic drawings is purely educational.
* What i write here is not an investment advice. Please do your own research before investing in any asset.
* Never take my personal opinions as investment advice, you may lose your money.

SEIUSDT 1D AnalysisSEI ~ 1D Analysis
#SEI Buy gradually after retesting this support block with a short term target of at least 15%+ from here.

SEI LONG RESULTPrice Broke out of the Falling Wedge Pattern with Double Bottom reversal pattern and consistently holding Supports and creating HH & HL.
I Opened the first long setup which price missed by a few cents, then I initiated another long position from a newer held Support Above and it went smoothly as planned.😉
THE KLASSIC TRADER🎯

SEI/USDT Daily Chart Analysis – Potential Reversal ConfirmedThe SEI/USDT chart on the daily timeframe presents a notable Inverse Head and Shoulders (IH&S) pattern, which appears to have completed successfully. The neckline breakout occurred with a strong bullish impulse, suggesting a potential trend reversal from the prior downtrend.
Following the breakout, price encountered a significant resistance zone between $0.275 - $0.295, which acted as a supply area and triggered a short-term pullback. This level aligns with a previous structural breakdown point, adding to its validity as a resistance.
A key demand zone (highlighted in green), located between $0.195 - $0.229, has been marked as the “Long Idea” zone. This area previously served as resistance and now has the potential to flip into strong support upon retest, offering a favorable long entry if price revisits the zone. The current price action suggests that this retest may occur, offering an opportunity to enter with a better risk/reward ratio.
The measured move target from the IH&S pattern points towards the $0.35 region, which also coincides with a major horizontal resistance zone and serves as the primary take profit (TP) target.

#SEI/USDT#SEI
The price is moving within a descending channel on the 1-hour frame, adhering well to it, and is heading towards a strong breakout and retest.
We are seeing a bounce from the lower boundary of the descending channel, which is support at 0.2550.
We have a downtrend on the RSI indicator that is about to be broken and retested, which supports the upward trend.
We are looking for stability above the 100 Moving Average.
Entry price: 0.2579
First target: 0.2626
Second target: 0.2681
Third target: 0.2750

SEIUSDT: Trend in daily time frameWe have two trends, be careful
The color levels are very accurate levels of support and resistance in different time frames, and we have to wait for their reaction in these areas.
So, Please pay special attention to the very accurate trend, colored levels, and you must know that SETUP is very sensitive.

Sei long to $0.28+ today!NYSE:SEI long
🎯Target : $0.2802
🛑Stop: $0.2575 or lower
💰Roughly 4-6RR from my entry
#seiusdt

#SEIUSDT remains in bullish continuation mode📉 LONG BYBIT:SEIUSDT.P from $0.2747
🛡 Stop loss: $0.2640
🕒 Timeframe: 4H
✅ Market Overview:
➡️ Falling Wedge pattern has played out — confirmed breakout to the upside.
➡️ A strong Inverse Head and Shoulders pattern is visible — neckline broken with momentum.
➡️ Volume increases on upward impulse — bullish confirmation.
➡️ Current price is consolidating slightly — likely preparing for the next leg up.
➡️ POC at $0.1697 is far below — market structure flipped bullish.
➡️ Clear upward projection toward the $0.2810–$0.2910 range.
🎯 TP Targets:
💎 TP 1: $0.2810
💎 TP 2: $0.2870
💎 TP 3: $0.2910
📢 Holding above $0.2740 confirms bullish structure.
📢 Watch for minor resistance near TP1, then potential continuation to TP2 and TP3.
📢 Secure partial profits at TP1, and let the rest ride toward higher targets.
📢 It’s advisable to partially take profits near the specified resistance levels.
📢 A retest of the breakout zone (around $0.22) is possible — this can be used for adding to the position.
🚀 BYBIT:SEIUSDT.P remains in bullish continuation mode — targets still active!

Sei bit pump to $0.28Just now entered a long position on Sei. Targeting 0.28
However, I'll be looking to close out most of the position at $0.2575 then afterwards depending on the PA I might scale back in. Also if no minor retest before $0.25 I might take partial there.
Stop: $0.2338 or lower

SEI iHnS PatternSEI potentially confirmed inverse HnS pattern with create another lower high and now sitting on resistance
break resistance we will see price around 0.29

SEIUSDT Breakout Holds Strong – Eyes on Key Higher Low FormationSEIUSDT has recently completed a significant technical breakout from a falling wedge pattern that had been compressing price for an extended period. This wedge was defined by a consistent sequence of lower highs and lower lows, suppressing bullish momentum and holding the market in a downtrend. The breakout above wedge resistance not only invalidated this structure but also confirmed a fresh higher high — a key signal that the trend dynamics may be shifting.
What makes this breakout technically significant is the structural transition it represents. For the first time in a while, buyers were able to overcome resistance and push price beyond the previous swing high. This break in the bearish sequence hints at a potential reversal, but a critical confirmation is still required.
The current focus is now on the formation of a higher low, ideally at the 0.618 Fibonacci retracement level, which aligns closely with the value area low (VAL) from the recent range. A successful retest and bounce from this zone would further solidify the bullish transition and establish the foundation for a potential move toward the upper boundary of the range.
If this structure plays out as anticipated, the next major target would be the range high resistance, offering a potential 80% upside from current prices. This level also coincides with previous supply zones and will be crucial to monitor for any signs of rejection or continuation.
Volume remains a critical element in this setup. The breakout occurred on improving volume, but follow-through volume will be necessary to validate the move. Bullish continuation without volume support often leads to failed breakouts or chop. A rise in volume during the retest and bounce would signal increased buyer interest and further support the case for upside continuation.
Summary:
SEIUSDT has flipped its bearish structure with a clean wedge breakout and higher high. The next step is confirming a higher low at the 0.618/VAL region. If successful, the probability for a move toward the range high increases significantly.
Technical Levels to Watch:
Support: 0.618 Fib & Value Area Low
Resistance: Range High
Volume: Needs to pick up for bullish continuation
Follow this post to stay updated on how this setup evolves.
This is not financial advice — always do your own research and manage your risk.

Sei short to $0.1991Just now opened a short position on sei. Targeting $0.1991.
Sell off seems likely . Around $0.1991 I anticipate enough demand might come back into the market to cause a reversal or consolidation

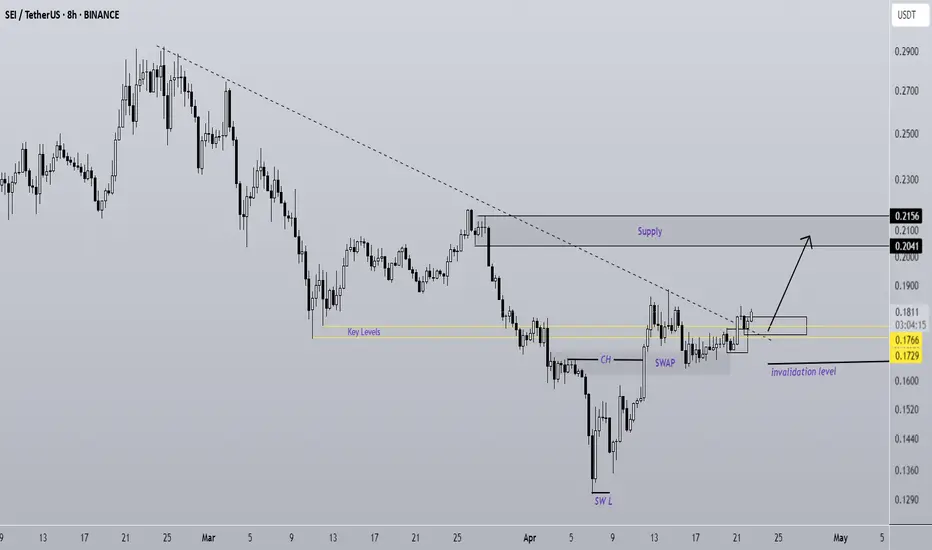
SEI Is A Rocket (8H)SEI has started a strong move from the bottom.
After breaking through a resistance zone with little to no reaction, it has now formed a SWAP zone.
Buy orders have been effectively transferred from the SWAP area into the candles, and the price shows strong momentum to push toward higher levels.
As long as the demand zone holds, SEI has the potential to reach the marked target area | or even go beyond it.
However, a daily candle closing below the invalidation level would invalidate this analysis.
Do not enter the position without capital management and stop setting
Comment if you have any questions
thank you
Sei dump back to $0.2156NYSE:SEI short
0.224 stop or higher
Tp 1: $0.2173...70%
Tp2: $0.2156...close

#SEI/USDT#SEI
The price is moving within a descending channel on the 1-hour frame and is expected to break and continue upward.
We have a trend to stabilize above the 100 moving average once again.
We have a downtrend on the RSI indicator that supports the upward move with a breakout.
We have a support area at the lower limit of the channel at 0.2000, which acts as strong support from which the price can rebound.
Entry price: 0.2032
First target: 0.2074
Second target: 0.2119
Third target: 0.2164

SEI/USD Long Setup (3D Timeframe)
📈 Overview:
Yesterday, the last 3D bar closed, triggering a LONG entry signal. The price is above the MLR, SMA, and PSAR, which are positive indicators that align with a bullish trend. However, caution is required as the price is currently below the key 200 MA, a level that can act as a strong resistance.
📊 Entry Conditions:
- Price > MLR > SMA > PSAR: Bullish alignment across all key indicators.
- Long Entry: Triggered by the 3D bar close and the alignment of indicators.
⚠️ Risk Warning:
- 200 MA: The price is below the 200-day moving average, which could act as resistance. This is a critical level to watch out for.
- Market Caution: While the signals point towards a potential uptrend, the 200 MA being below the current price adds a layer of risk. We need to be cautious, especially as price could face rejection at this level.
📍Trade Strategy:
- Stop Loss (SL): Consider setting it below last PSAR level to manage downside risk effectively.
- Since the stop loss (SL) is wide, a spot entry is preferred
🔍 Conclusion:
This is a high-risk, high-reward setup. Given the 200 MA resistance, it’s important to monitor price action closely for signs of rejection. If the price breaks above the 200 MA, this could turn into a strong uptrend. Stay flexible and adjust your risk management as needed.
💬 Drop a comment with your thoughts and follow for more updates! 🚀

Sei's Downtrend Has Been Broken —Bull Market Cycle & ProfitsSei's downtrend has been broken, prepare for bullish momentum to build up as SEIUSDT moves toward higher prices. A long-term higher high first followed by a very strong new All-Time High in late 2025. Are you ready?
The downtrend line is shown on the chart. It broke around April 19 and the action has been green since.
We have a perfect bottom pattern and the action is happening safely above the 3-Feb. low.
This is a solid chart setup and reveals that the type of action the market will present consist of straight up, literally. Notice the correction, it has a perfect decline. The same will be true for the rise, you will be able to draw a perfect line for the higher lows as prices rise. The higher highs can become erratic but the base will be stable. There will be huge growth. Current action reveals this clearly.
» The first target has 420% profits potential and the second one 700%. These are strong targets yet easy to achieve. Total growth would be much higher if you start counting from the 7-April low but it is too late for bottom prices now. It is still early though based on the broader picture and market cycle.
It is late for the true bottom, but it is early for huge profits. Understand what I mean?
It is normal not being around when the market hits bottom because the fact that the market is trading at bottom prices means that it is depressed. Nobody wants to be around depressed energy so people go away. But this energy doesn't last forever, it never does things change.
Everything is changing now and instead of a depressed market we will have a growing market, euphoria, fun, excitement and profits. Money is yours to take.
You can make as much as you want, the market will never limit you in any way.
It all depends on your mindset and preparation, how much money are you ready to take home in this Cryptocurrency market bullish phase?
You have my support.
Thank you for reading.
Namaste.

Clean confirmed bottom 15,000 TPS.
Market makers are getting incentives.
Weekly RSI bullish crossing.
