SEI solid 60% bounceNYSE:SEI had a solid 60% bounce and looks better than most charts out there — but it's sitting just below weekly resistance.
Would be healthier to build a base here before any push higher.
SEIUSDT trade ideas

#SEI/USDT#SEI
The price is moving within a descending channel on the 1-hour frame and is expected to break and continue upward.
We have a trend to stabilize above the 100 moving average once again.
We have a downtrend on the RSI indicator, which supports the upward move by breaking it upward.
We have a support area at the lower limit of the channel at 0.1880, acting as strong support from which the price can rebound.
Entry price: 0.1916
First target: 0.1954
Second target: 0.1998
Third target: 0.2052

SEIUSDT | Long | Flipping Resistance into Support | (April 2025)SEIUSDT | Long | Flipping Resistance into Support | (April 23, 2025)
1️⃣ Short Insight Summary:
SEIUSDT is looking strong on higher timeframes, showing signs of a clean retest. If this level holds as support, we could be gearing up for a solid move higher.
2️⃣ Trade Parameters:
Bias: Long
Entry Zone: Around $0.17 to $0.22 (confirmation of support flip)
Stop Loss: Below the recent swing low (approx. $0.18)
TP1: $0.28
TP2: $0.42
Partial Exits: Around $0.24 for a more conservative exit
✅ Risk-Reward Ratio: Approx. 1:2 to 1:2.5 depending on entry
3️⃣ Key Notes:
On the 4H chart, price structure shows SEIUSDT flipping a previous resistance into support — a classic bullish signal.
📉 30-min timeframe: Some money outflow hints at a short-term pullback or correction.
📈 4H and Daily chart: Money flow is coming in strong, backing the idea of continuation to the upside.
This setup fits well for a swing trade, with solid confluence across multiple timeframes. A hold above $0.22 increases confidence.
4️⃣ Optional Follow-up Note:
I’ll keep an eye on this and share any updates if the trade starts playing out.
Please LIKE 👍, FOLLOW ✅, SHARE 🙌 and COMMENT ✍ if you enjoy this idea! Also share your ideas and charts in the comments section below! This is best way to keep it relevant, support us, keep the content here free and allow the idea to reach as many people as possible.
Disclaimer: This is not financial advice. Always conduct your own research. This content may include enhancements made using AI.

$SEI/USDT BREAKOUT ALERT $SEI/USDT Breakout Alert!
After months in a downtrend channel, SEI has broken out to the upside with strong momentum.
A bullish reversal is in play.
Entry: $0.1691
Stop Loss: $0.1301
Target: $0.6364 ( 275% potential upside)
Classic falling wedge breakout with volume confirmation. Eyes on the next leg up! 👀📊

#SEI/USDT#SEI
The price is moving within a descending channel on the 1-hour frame, adhering well to it, and is heading for a strong breakout and retest.
We are seeing a bounce from the lower boundary of the descending channel, which is support at 0.1693.
We have a downtrend on the RSI indicator that is about to be broken and retested, supporting the upward trend.
We are looking for stability above the 100 moving average.
Entry price: 0.1700
First target: 0.1724
Second target: 0.1743
Third target: 0.1766

SEI Trend Reversal? Breakout + Higher Low ConfirmedNYSE:SEI has broken above the key descending resistance line, signaling a shift in momentum after an extended downtrend. The price also rebounded strongly from the support zone marked in the chart, forming a clear higher low.
Currently, SEI is pushing through a critical zone where support previously flipped into resistance, now testing the 50 EM as the next challenge.
If the price can hold above this zone and close with strength, the next leg up could target $0.30–$0.50, as shown on the chart.
DYOR, NFA

Sei scalp long to $0.1832Sei limit order scalp long.
Limit entry: $0.1774
Stop: $0.1745
Target: $0.1832
Off to bed. I plan on waking up with my entry being filled and tp smashed.

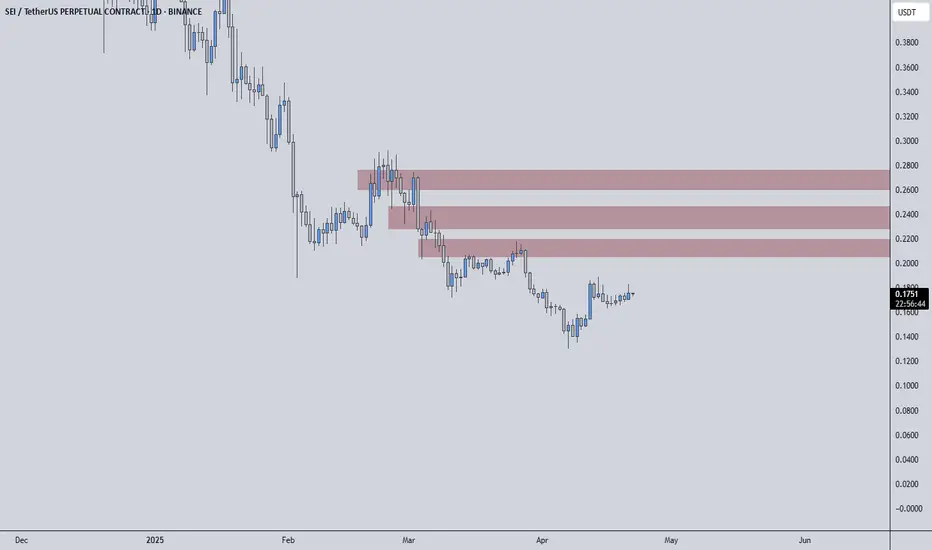
SEIUSDT | Weak Structure Persists, Eyes on Red Box ResistanceSEIUSDT continues to reflect weakness in its structure, and until proven otherwise, the red boxes remain key resistance zones. Buyers are still not stepping in with meaningful strength, and the overall market context doesn’t support a bullish shift yet.
🔴 Resistance Zones Are Still Dominant
The red boxes align with former support levels that now act as barriers. This type of flip often traps late buyers and offers great setups for short opportunities — but only with confirmation.
🔍 What to Watch For
Lower-Time-Frame Breakdown Patterns: Inside these red boxes, look for signs like bearish engulfing candles or lower highs on the 5-15 min charts.
CDV & Orderflow Weakness: If cumulative delta volume and tape show absorption or hidden selling, the likelihood of rejection increases.
Risk Management First: Use these zones not just for direction, but for well-defined invalidation points. If price pushes through and retests from above, then it's time to pivot your bias.
🚨 If Buyers Show Up…
I won’t stick to my short bias blindly. If SEIUSDT can break through the red resistance with strength, and more importantly hold above it, I will reassess and look for long setups — especially on the retest with bullish confirmations.
Markets can shift quickly, and we trade based on what the chart shows, not what we hope. For now, SEI remains under pressure. Be patient, act on signals, and never force a trade just because the price is near a key level.
📌I keep my charts clean and simple because I believe clarity leads to better decisions.
📌My approach is built on years of experience and a solid track record. I don’t claim to know it all but I’m confident in my ability to spot high-probability setups.
📌If you would like to learn how to use the heatmap, cumulative volume delta and volume footprint techniques that I use below to determine very accurate demand regions, you can send me a private message. I help anyone who wants it completely free of charge.
🔑I have a long list of my proven technique below:
🎯 ZENUSDT.P: Patience & Profitability | %230 Reaction from the Sniper Entry
🐶 DOGEUSDT.P: Next Move
🎨 RENDERUSDT.P: Opportunity of the Month
💎 ETHUSDT.P: Where to Retrace
🟢 BNBUSDT.P: Potential Surge
📊 BTC Dominance: Reaction Zone
🌊 WAVESUSDT.P: Demand Zone Potential
🟣 UNIUSDT.P: Long-Term Trade
🔵 XRPUSDT.P: Entry Zones
🔗 LINKUSDT.P: Follow The River
📈 BTCUSDT.P: Two Key Demand Zones
🟩 POLUSDT: Bullish Momentum
🌟 PENDLEUSDT.P: Where Opportunity Meets Precision
🔥 BTCUSDT.P: Liquidation of Highly Leveraged Longs
🌊 SOLUSDT.P: SOL's Dip - Your Opportunity
🐸 1000PEPEUSDT.P: Prime Bounce Zone Unlocked
🚀 ETHUSDT.P: Set to Explode - Don't Miss This Game Changer
🤖 IQUSDT: Smart Plan
⚡️ PONDUSDT: A Trade Not Taken Is Better Than a Losing One
💼 STMXUSDT: 2 Buying Areas
🐢 TURBOUSDT: Buy Zones and Buyer Presence
🌍 ICPUSDT.P: Massive Upside Potential | Check the Trade Update For Seeing Results
🟠 IDEXUSDT: Spot Buy Area | %26 Profit if You Trade with MSB
📌 USUALUSDT: Buyers Are Active + %70 Profit in Total
🌟 FORTHUSDT: Sniper Entry +%26 Reaction
🐳 QKCUSDT: Sniper Entry +%57 Reaction
📊 BTC.D: Retest of Key Area Highly Likely
📊 XNOUSDT %80 Reaction with a Simple Blue Box!
📊 BELUSDT Amazing %120 Reaction!
I stopped adding to the list because it's kinda tiring to add 5-10 charts in every move but you can check my profile and see that it goes on..
SEI/USDTBINANCE:SEIUSDT
"Everyone’s bearish, but I’m stacking more NYSE:SEI 🚀
50% fib on the daily + possible bullish retest at $0.1740 support!
(Not dropping all my charts—you get the idea 😉)"
`Disclaimer: I am not financial advice

Sei scalp long to $0.1726Just now opened a long position on sei. Anticipating a pump back up to $0.1726 area at least before more dump...or maybe we just pump right through target

SeiUsdt LongTradeable idea, this pair broke through the trendline and it considiladated above it, look to open long positions from here.

#SEI/USDT Analysis📊 #SEI/USDT Analysis 📊
NYSE:SEI has broken the Daily Diagonal Trendline and is currently holding the Daily FVG—a key bullish sign!
📈 Key Level:
Resistance: PWH $0.186
💡 If this FVG holds, we could see NYSE:SEI explode soon.
Patience might just pay off here!

Sei scalp longJust now opened a long position on sei.
I attempted to short it earlier but momentum is slow, market is itching to go up. It's high but with the daily trend and I think it will likely spike up today as it flipped bullish on the 15 min tf + formed inverse head and shoulder reversal pattern among other things in confluence with my DTT setup

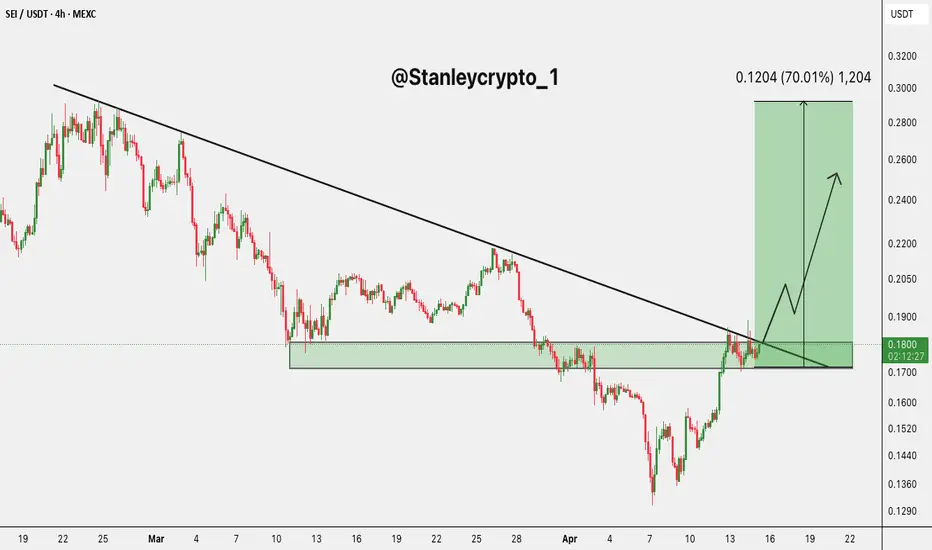
$SEI BREAKOUTNYSE:SEI looking ready to break out! 🚀
Price is testing a key descending trendline and consolidating just above significant support
Bullish breakout scenario could send it flying +70% to $0.30 if momentum follows through 👀
Break and retest zone in play 🔁
SEI | 3D Macro Setup Still watching patiently.
🔹 Price has broken the parabolic downtrend, but no confirmation of reversal yet.
🔹 AO (Awesome Oscillator) is printing a clean bullish divergence — first signal of momentum shift.
🔹 We’re sitting just above the Point of Control (POC) — the area with the highest volume traded.
📌 My preference:
Would love to see a final flush sub-$0.10 to sweep liquidity → trigger a fast reversal.
But… not convinced we’ll get it. If we don’t — any reclaim above $0.20 likely results in a swift breakout.
🎯 Why this matters:
Once confirmed, there’s very little resistance overhead. The upside could be vertical.
⚠️ Patience here is key. If it breaks up — it’s likely to go fast.

SEI shortJust now opened a short position on SEI. I antiicpate market will fall back to $0.1688 area or lower to retest before any higher prices unless get some high impact bullish news


SEI 1D ANALYSISHi friends,
Today we pay attention to the SEI chart in the daily time frame; we have a local resistance level at the price of $0.2143, which is good for long entries after the daily candle closes above it.
It has a strong daily resistance trend line, which, after it breaks and pulls back, allows us to enter into long positions with volume confirmation.
The main daily resistance level is at the price of $0.3446

#SEI/USDT#SEI
The price is moving within a descending channel on the 1-hour frame, adhering well to it, and is heading for a strong breakout and retest.
We are seeing a bounce from the lower boundary of the descending channel, which is support at 0.1754.
We have a downtrend on the RSI indicator that is about to be broken and retested, supporting the upward trend.
We are looking for stability above the 100 moving average.
Entry price: 0.1823
First target: 0.1847
Second target: 0.1884
Third target: 0.1942

#SEI/USDT#SEI
The price is moving within a descending channel on the 1-hour frame, adhering well to it, and is heading for a strong breakout and retest.
We are experiencing a rebound from the lower boundary of the descending channel, which is support at 0.1600.
We are experiencing a downtrend on the RSI indicator, which is about to break and retest, supporting the upward trend.
We are looking for stability above the 100 Moving Average.
Entry price: 0.1614
First target: 0.1625
Second target: 0.1642
Third target: 0.1665

#SEI/USDT#SEI
The price is moving within a descending channel on the 1-hour frame and is expected to continue upward.
We have a trend to stabilize above the 100 moving average once again.
We have a downtrend on the RSI indicator that supports the upward move with a breakout.
We have a support area at the lower boundary of the channel at 0.1700.
Entry price: 0.1730
First target: 0.1764
Second target: 0.1808
Third target: 0.1850

SEI — Breakout + Strong Fundamentals = Perfect 1:9 SetupFinally broke the downtrend line — and it's not just about the technicals here. Fundamentals on SEI are looking really solid, and that adds even more confidence to the setup.
Planning to load on a small pullback and retest of the trendline — that’s where the real entry lies.
This one’s shaping up to be a textbook 1:9 RR play. Don’t sleep on it.
Enrty: 0.17-0.178
TP: 0.4
SL: 0.15
More thoughts in my profile @93balaclava
Personally I trade on a platform that offers low fees and strong execution. DM me if you're curious.

SEI - 2 Possibility 1 solutionSo smol range is easy move the big ranges is how it can move to be precise!!
