seiMy personal opinion is this: We have a support in the green line area, which if broken, can continue to the blue line. In the short term, we also have a resistance that can be seen at lower numbers until it is broken.
SEIUSDT trade ideas

SEI looking a lot like the start of Solana '20-'21 Good day fellow traders.
Just noticed that the SEI cycle looks a lot like solana in 20-21
When you looking at the BTC pair, you will see the same
comparison.
For now its important that de base (red channel) hold as support.
I will update this later.
Cheers !
TJ_Crypto_NL (X)

SEIUSDT Target is $0.8888!SEIUSDT – Eyeing a Breakout to $0.8888! 🚀🔥
SEI has been consolidating after a strong downward trend, but is this the beginning of a major reversal? The 4H chart is showing some key signals that traders should keep an eye on. Let’s break it down:
🔹 Current Market Structure
SEI is currently trading at $0.2719, holding above the key support zone at $0.2438. This level is crucial—if it holds, we could see bullish momentum building up.
🔹 EMA Break & Trend Shift?
The price is testing the Exponential Moving Average (EMA), which has acted as resistance in the past. A clean break above this EMA could confirm a trend reversal and push prices higher.
🔹 Major Resistance & Breakout Level 🚀
The ultimate target on my radar? $0.8888 📈. This level represents a key resistance area where a major breakout could occur. If SEI gains enough traction, we could see a strong push towards this price point in the coming months.
🔹 What’s Driving SEI’s Future?
Beyond the charts, SEI remains a game-changing Layer 1 blockchain, optimized for decentralized exchanges (DEXes) and NFT trading. With growing adoption and strong fundamentals, SEI has long-term potential, with analysts forecasting prices reaching $1.12+ in 2025 and $3+ by 2030!
Key Levels to Watch 🔥
✅ Support: $0.2438
✅ Breakout Zone: $0.30 - $0.35
✅ Major Resistance: $0.8888
✅ Long-term Target: $1.12+
Final Thoughts 💡
SEI is showing signs of life, and this could be the start of a bullish move. If momentum picks up and price reclaims key resistance levels, we could see explosive growth in the coming months. Are you watching SEI? Let me know your thoughts in the comments! 🚀
📢 Follow for more market insights!
One Love,
The FXPROFESSOR 💙

SEI/USDT - Key Demand Zone & Trendline SupportDescription:
Entry: Around $0.2276, near demand zone and trendline support.
Stop-Loss: Below $0.2218, invalidating the bullish setup.
Take-Profit: Targeting $0.2514, anticipating a bounce.
Indicators: RSI near oversold, potential reversal signal.
Confirmation: Watch for volume increase and bullish candlestick patterns.

$SEI/USDT Trading IdeaSEI is looking solid. Not many coins on the higher timeframe look as good as SEI and TAO right now. Of course, the price can always go lower, but the market structure is there, and we can start cooking based on the data we have.
One thing is clear, we need a clean breakout from this descending trend to open the door for a retest around $0.60.
A breakout could send it 100%+ higher, maybe even more. Keep an eye on this setup. The outcome could be massive.

#SEIUSDT maintains bullish momentum📈 LONG BYBIT:SEIUSDT.P from $0.2922
🛡 Stop Loss: $0.2867
⏱ 1H Timeframe
✅ Overview:
➡️ BYBIT:SEIUSDT.P is in an uptrend after consolidating in the support zone, confirming buyer dominance.
➡️ Volume Profile indicates that the main liquidity ( POC ) is positioned at $0.274, confirming volume redistribution towards buying.
➡️ A breakout above $0.2922 and consolidation will trigger further upside movement.
➡️ The nearest targets are in the $0.2980 – $0.3030 range, where profit-taking may occur.
⚡ Plan:
➡️ Long entry upon breaking $0.2922, confirming bullish momentum.
➡️ Stop-Loss at $0.2867—placed below the nearest liquidity zone to minimize risk.
➡️ Main targets: $0.2980 and $0.3030, where partial profit-taking may be considered.
🎯 TP Targets:
💎 TP 1: $0.2980
🔥 TP 2: $0.3030
🚀 BYBIT:SEIUSDT.P maintains bullish momentum — expecting further upside!
📢 BYBIT:SEIUSDT.P is forming a bullish trend, and consolidation above $0.2922 may accelerate the uptrend.
📢 Monitor price reactions around $0.3030, as this could act as a resistance zone for potential corrections.

short SEISEI is bouncing off the resistance level and the descending trendline. The bearish movement to the support level at $0.21 is expected to happen!

$SEI BreakoutThere is a consolidation above the 50 EMA, the reaction is good enough, I expect a trendline breakout. Do not miss the growth!
Horban Brothers.

SEIUSDT UPDATESEIUSDT is a cryptocurrency trading at $0.2740. Its target price is $0.4500, indicating a potential 60%+ gain. The pattern is a Bullish Falling Wedge, a reversal pattern signaling a trend change. This pattern suggests the downward trend may be ending. A breakout from the wedge could lead to a strong upward move. The Bullish Falling Wedge is a positive signal, indicating a potential price surge. Investors are optimistic about SEIUSDT's future performance. The current price may be a buying opportunity. Reaching the target price would result in significant returns. SEIUSDT is poised for a potential breakout and substantial gains.

C’mon SEI.. we are waiting for you..Dit SEI had its bottom? Will this be the reversal of our long wanted ALT season?
The chart looks great! But what will BTC do?

SEI/USDT#SEI/USDT has reached a strong support zone, with a potential bullish reversal in play. 📈
Key Observations:
The price has tested a historical support level multiple times.
A breakout from the downtrend could signal a move towards $0.94.
Short-term resistance expected around $0.40 - $0.50 before further upside.
If NYSE:SEI maintains support and follows this structure, a recovery toward the $0.90+ range could be in play. 🚀 Keep an eye on volume and market sentiment!

SEIUSDT - UniverseMetta - Analysis#SEIUSDT - UniverseMetta - Analysis
The price may rebound from the support level, which may additionally indicate growth: on the lower timeframe, a 3-wave structure is forming. If we look at the higher timeframe, there is a potential formation of ABC formation. The nearest movement may be to the trend line, to retest the previous upward movement. Further we should expect the formation of a 3 wave structure, to increase purchases Potential yield may be 322% from this level.
Target: 0.3755 - 1.0741

SeiusdtBullish case
1.It’s broke it’s resistance 0.25 and goes to 0.30 level but if sustain 0.25
2.Trump liberity etf buy this shit
Bearish case
if it’s goes down 24 may retest its previous support

#SEI/USDT#SEI
The price is moving in a descending channel on the 1-hour frame and is adhering to it well and is heading to break it strongly upwards and retest it
We have a bounce from the lower limit of the descending channel, this support is at a price of 0.2138
We have a downtrend on the RSI indicator that is about to break and retest, which supports the rise
We have a trend to stabilize above the moving average 100
Entry price 0.2260
First target 0.2300
Second target 0.2350
Third target 0.2400

Sei ABC Correction & 984% Target (2025 ATH Will Be Higher)Based on the MKRUSDT Elliott Wave Theory publication , we know that a bullish impulse comes after a correction.
Here we have SEIUSDT with a classic ABC correction after a 5 up-wave pattern (bullish impulse). After the ABC a new bullish impulse will develop which means five up-waves.
This is very interesting because we are looking at a bottom catch.
SEIUSDT bottomed in February 2025 as a technical double bottom, vs the August 2024 low, and a higher low, vs the October 2023 low.
This is all good but why is this important?
Once we hit bottom, there is no place left to go but upwards.
SEIUSDT just hit bottom and this bottom is very likely to be followed by the strongest bullish wave ever for this project because this is a new project.
The target on the chart is mildly strong but I still feel that I am being conservative here. Since this pair wasn't around in 2021, we don't know its potential for 2025. The only bullish wave we have is that one from late 2023 through early 2024.
So we have 984% potential being conservative, but the truth is that SEIUSDT is likely to peak much higher by the time the bull-market ends. It will be wild. It will be amazing.
Thanks a lot for your continued support.
Namaste.

Sei short back to $0.2249Just now hopped into a sei short. I anticipate it will correlate with bitcoin as bitcoin is likely to fall back to $94000 and if that happens I think sei will also continue to fall.
$0.2249 sees like a good area to exit due to some support in that area.
Time sensitive

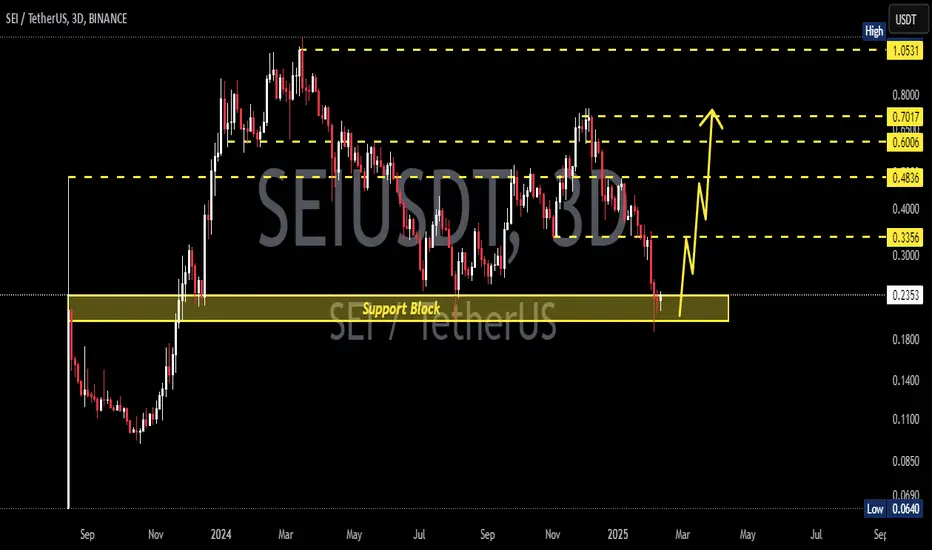
SEIUSDT 3DSEI ~ 3D Analysis
#SEI Buy from here if you still have a Conviction on this coin with a minimum target of 20%++.
$sei short to $0.22-0.21Just now opened a short on $sei.
I attempted a long on it today but bulls are finding it difficult to break back up higher. And the trend is still down overall so am just gonna short it a bit until that changes.

SEI | ALTCOINS | +150% Bounce Zone TARGETSEI is an altcoin that bounces well from support zones and therefore excellent to trade as a swing trade.
You can confirm that SEI bounces from support zones by taking a look at this post I made in August last year, just before SEI increased 232%:
For the short term, there seems to be no clear indication of a turnaround, but the good news is that a better buy zone is approaching for the next impulse wave up - which could be a really big swing.
_____________________
BINANCE:SEIUSDT

#SEI/USDT#SEI
The price is moving in a descending channel on the 1-hour frame and is adhering to it well and is heading to break it strongly upwards and retest it
We have a bounce from the lower limit of the descending channel, this support is at a price of 0.2260
We have a downtrend on the RSI indicator that is about to be broken and retested, which supports the rise
We have a trend to stabilize above the moving average 100
Entry price 0.2362
First target 0.2555
Second target 0.2727
Third target 0.2900

SEII see bullish move on 15mtf on SEI everything is mentioned on charts lets see how market move is it in our side or not 1:3RR

SEI longSEI is at support, and at strong support.. so it looks like a good bounce. If we're still in a bull market, it will shoot up a lot.

$sei to $0.2828I just recently open a long position on Sei.
Its breakout out now. I anticipate it will pump back up to $0.2828 area
Time sensitive
