SEI: Strong Bearish Volume 4X-SHORT—183% PotentialThis can turn out to be a powerful SHORT. Even though we develop a market bias by looking at hundreds of charts, all the signals (trade-numbers) are based on technical analysis. We use the broader market picture only to support the signals already coming from the chart.
If a chart looks weak or mixed, instead of imposing our beliefs on it we simply move on and find one that looks better. There are too many choices to peak the ones that a clearly doubtful.
Some grow while others go down.
The highest volume for SEIUSDT came on the 1st of October and this was a bearish session (closed red). High volume indicates that the bears are entering the market with force. After this signal, we saw lower prices, the start of the bearish impulse. We are seeing a bounce now, pull-back, and this can be used as an opportunity to sell.
The chart looks good but remember, market conditions can always change. This is not risk free, that is why you need to plan and have the right mindset if you decide to trade.
Some times we win, other times to we lose. But we try to make it so that we have more winning than losing trades. As for you, you just need to come out ahead as you grow and learn. If you are already experienced; Thanks a lot for your support &, Enjoy the profits.
Full trade-numbers below:
____
SHORT SEIUSDT
Leverage: 4X
Entry levels:
1) $0.4444
2) $0.4000
3) $0.3800
Targets:
1) $0.3480
2) $0.3310
3) $0.3000
4) $0.2810
5) $0.2510
6) $0.2345
7) $0.2080
Stop-loss:
Adjust to your own risk tolerance
Potential profits: 183%
Capital allocation: 3%
_____
The most successful traders in the world are not those that win 9 out 10. The biggest money makers are those that have a consistent plan and continue to improve everyday. The biggest earners tend to be those that catch a big move before it happens and max-out on those trades. Something like, "cut the bad trades fast, let the winners run."
When a trade goes bad, accept it, take the loss and move on.
When a trade goes good, make sure to maximize profits on it; let it run.
Here we have another chart setup, the last one of this session. It looks good, it doesn't mean that it must be a success. Anything goes, but we know the risk, the probabilities are toward the downside and thus, SHORT next.
When the market is bullish (trading low/near support) we go LONG instead.
This is not financial advice.
I am sharing my experience for learning purposes and for your entertainment.
Thank you for reading.
Namaste.
SEIUST trade ideas

SEI swing long setupThis might never hit entry and if it does it can take a long time to play out. I have placed the limit order in case it comes down there.
DISCLAIMER: I am not providing trading signals or financial advice. The information shared here is solely for my own documentation and to show what I am doing. If you choose to act on any of this information, you do so at your own risk, and I will not be held responsible for any outcomes. Please conduct your own research and make informed decisions.
SEI Coin is forming a Bullish Flag Pattern on the 1 Day chart.👀 SEI Coin is forming a Bullish Flag Pattern on the 1 Day chart. ▶️
🔽🔽 Rejected by the resistance above it, the market is currently going down. You can get the Bullish Flag pattern here after the Brackout to make a longer position successful 🕯
💵That is the profit target you can get for the long position
✅TP 1 - 0.5743
✅TP 2 - 0.6610
✅TP 3 - 0.7260
✅TP 4 - 0.7602
✅TP 5 - 0.8020
✅TP 6 - 1.0200

#SEI $SEI has got one more leg down#SEI is in a downtrend and has broken its structure and ready to go down.
Entry:CMP
TP: 0.3630
SL: 0.4000(4Hr Close)

SEI Weekly Analysis: 📈 SEI Weekly Analysis:
SET:SEI is currently accumulating below mid-resistance, forming a massive bullish flag. Short-term, expecting range between mid-resistance and demand zone, then prepare for breakout.
Short-Term I am looking for ranging between mid-resistance & demand zone, then get ready for breakout🚀
🎯mid-term target - 0.6240$
🎯mid-term target - 0.8920$
🎯long-term target - 1.1470$
🎯long-term target - 1.7240$.

Analysis of SEI/USDT Chart: Potential Target $5+In this weekly SEI/USDT chart, the price action reveals a strong support zone around the $0.18 to $0.35 range, highlighted in orange and yellow. This level has historically served as a foundation for price stabilization, which could indicate a potential area for accumulation before any upward move.

SEI Long Spot Trade (CHoC & Support Flip)Market Context: SEI’s recent price action is suggesting a potential reversal with a Change of Character (CHoC) confirmed by a higher high and a retest of the $0.35 resistance as support. A reclaim of the 200 EMA as support would add strength to the upward continuation outlook.
Trade Setup:
Entry: Around $0.40
Take Profit:
First target: $0.63
Second target: $0.89
Stop Loss: Daily close below $0.34
This setup is positioned to capitalize on the momentum shift, with upside targets aligning with higher levels if support holds. #SEI #Crypto #Trading

I'm bullish on Sei.. Modern layer 1..For the upcoming period i'm very bullish on SEI.
From what i've researched it's a very fast and modern layer 1.
I started to see high volumes on large and reliable exchanges like Binance, Upbit, Coinbase, Bybit etc.
I have indicated the possible targets in the chart.
* What i share here is not an investment advice. Please do your own research before investing in any digital asset.
* Never take my personal opinions as investment advice, you may lose all your money.

SEIUSDT - SHORT TERM Support in DANGERSEI is retesting a key support zone, and losing this support zone may lead to a hard drop.
The opening prices of SEI has not yet been retested, and in most cases for newly released altcoins the price will return to "retest" the opening price. In some cases, it even falls under - but it is quite common for he price to return to these zones.
I discuss a similar situation on NOTUSDT, which is showcasing a similar situation:
IF the price cannot keep closing daily candles ABOVE the current support zone, it's likely that a hard plummet will follow, since the price has lost the 200d moving averages in the daily, which equals short term bearish.
____________________
COINBASE:SEIUSD BINANCE:SEIUSDT

Long SEI - bottom of the channel /demand zoneEntry - on the demand zone.
SL - just under it
TP - above the current consolidation (where SL's will be for shorts)

SEIUSDT Assessing the Recent Bounce and Future TrendsThe SEIUSDT price recently reached our identified internal demand zone, triggering a sharp upward movement. The sustainability of this bounce will become evident within the next 72 hours. Our analysis anticipates that this upward movement will persist, aiming for a pullback towards the immediate sell-off zone before any further decline. The external demand zone, highlighted on the chart, represents a strategic point for significant accumulation.

SEI Below Support (Final Drop Of 2024 — Starts Bull-Market 2025)Look at this chart and tell, what do you see?
SEIUSDT first peaked in March and as soon as it moved below support, a drop was confirmed. This drop led to SEIUSDT reaching the lowest prices since November 2023.
In late September we have another peak and this peak is a lower high compared to March, the action already moved below support so the bearish bias is fully confirmed. This move below support can lead to another drop, a major drop and this drop can produce a lower low because it is happening from a lower high. The lower high is September 2024 vs March 2024. The lower low will be October/November 2024 vs August 2024.
And there you have it. A friendly warning. Good timing, the last time to sell before the drop.
Protect your capital, do whatever you need to do to have money on hand to be able to buy when prices are low.
The Cryptocurrency market is about to enter a fire sale, the lowest prices in years and this is good to buy and hold. We will have the last chance to see Crypto trading low before the bull-market of 2025.
It is both good and bad. It is bad because it is going down and some people are going to lose money because they are not reading this. It is good because there will be lower prices, new opportunities and many new people will join and participate in the market. It is also good because the correction phase will end and we will enter a major bull-market phase.
So it is good and good. Good because the correction will be over and good because it is the start of the bull-market, we are now only weeks away.
One final drop and we can focus on growth long-term.
Thank you for reading.
Namaste.

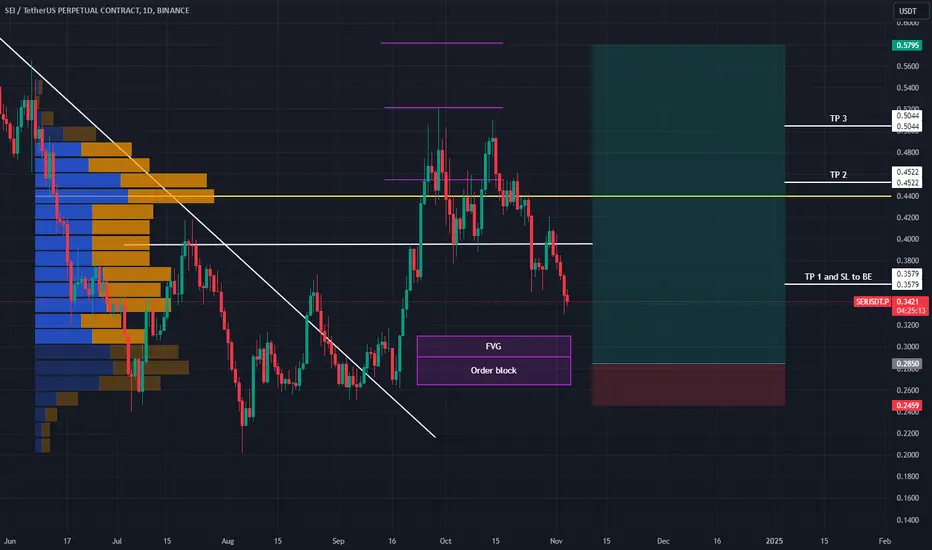
Alikze »» SEI | Double top - 1D🔍 Technical analysis: Double top formation in the supply area
- It is moving in an ascending channel in the daily time frame.
- The upward corrective wave has been able to return up to 0.50% of the Fibo of the previous wave, which has faced selling pressure in the supply area with the formation of a twin ceiling.
- Currently, with the failure of the negative line and selling pressure, if the price cannot stabilize above the 0.3906 range, there is a continuation of the downward trend up to the block order range.
- If it encounters demand in the green box area, it can have a return to the blue box area.
💎 In addition, if the selling pressure is sharp, the probability of breaking the green box area for the target is 0. 1954 will exist.
»»»«««»»»«««»»»«««
Please support this idea with a LIKE and COMMENT if you find it useful and Click "Follow" on our profile if you'd like these trade ideas delivered straight to your email in the future.
Thanks for your continued support.
Best Regards,❤️
Alikze.
»»»«««»»»«««»»»«««
BINANCE:SEIUSDT

SEIUSDT / LONG / M15SEIUSDT Potential Upside from Bearish Order Block
Bearish Order Block: 0.3694 to 0.3656
SEIUSDT is currently positioned within the bearish order block, which might signal an opportunity for a reversal to the upside. This setup indicates a potential entry for a long position, but observing price action here will confirm if it aligns with upward momentum. Let’s see how the price behaves in this area to gauge the strength of the reversal.
Entry Price :- 0.3694
Take Profit :- 0.3785
Stop Loss :- 0.3602

SEI: Your Last Chance to Buy — or Regret It Forever!SET:SEI is practically begging us to jump into this trade! We’re looking at a clear retest of the previous swing low, and it’s one of the rare assets breaking out of the bearish market structure.
If it hits 41 cents, that’s a steal, but don’t hold your breath—it’s likely to be a quick retest if it happens. This setup screams buy to me! Once SEI reclaims 55 cents, it’s going to fly towards the range high at 88 cents.
The choice is yours: act now or be left kicking yourself later! What are you waiting for?

SEI 1$ in comingSei will be the leader of this bull run; it looks really good. Right now, we’re holding it at support, so we’ll see. The plan is to hold it until it reaches $1. Once Bitcoin hits a new ATH, things will start happening differently.

My Set Up on this CoinI hope, this will be surely triggered my entry zone and going up smoothly SL and TP is always mentioned


SEI/USDT | Long-termThe chart speaks for itselfs. SEI has to hold 0.5 FIBO level (0.618, in the best case).
This really depends on BTC price action, but load your bags till the breakout, which looks almost imminent.

SEI long opportunity SEI price has come down in this channel to a key support level.
Watching price herebfor a reaction and possibly long entry.

#SEI Aiming for a 282% Surge? #SEIUSDT has formed a classic descending channel pattern on the daily chart, with a potential breakout on the horizon. Currently trading at $0.2783, the chart suggests a possible target of $0.7853, indicating a whopping 282.62% gain. This setup could be a golden opportunity for traders eyeing a significant return—will SEI deliver on its bullish promise?
⚠️ All trading ideas are published with a time delay. If you want to follow the trading in real-time, please follow the link:

SEI | Wen Airdrop ?Every time a new token launches, there’s a surge in excitement and hope, kind of like the night before a big concert.the price of Sei is $0.21 today with a 24hour trading volume of 480 million dollar. This represents a 20% price increase in the last 24 hours with a circulating supply of 1.8 Billion SEI, Sei is valued at a market cap of 400 million dollar.
Sei aims to create a blockchain that paves the way for effortless asset exchanges, according to its creators. Be it assets linked to social platforms, gaming, or even NFTs, Sei aspires to deliver the smoothest user experience.Earlier in May, Sei Labs secured $30 million in two funding rounds, with notable investors like Jump Crypto, Multicoin Capital, and Flow Traders backing them.
Sei also announced a cross chain airdrop for users who participated in Atlantic 2 testing and Sei Ambassador Program. Moreover, selected active users of popular blockchains including Solana, Ethereum, Arbitrum, Polygon, BNB Chain and Osmosis are likely to be whitelisted and eligible to take part in airdrop. Atlantic and Airdrop rewards will be claimable following an initial warmup period while the Sei Ecosystem get prepared.

SEIUSDT: Strong Support, Ready to Climb!!BINANCE:SEIUSDT has recently bounced back from a major support level, demonstrating resilience in its price action. After a brief retracement from a small resistance, the coin is currently trading at the Fibonacci 0.618 level, a significant point often associated with bullish reversals. Given SEI’s reputation as one of the fastest Layer 1 blockchains, coupled with its robust community support, we anticipate a potential uptrend from this level.
On the fundamental side, SEI has established itself as a leading Layer 1 blockchain, known for its speed and efficiency. The strong community backing further enhances its growth potential. With these fundamentals in mind, we can confidently expect SEI to aim for a new all-time high (ATH) in the near future.
BINANCE:SEIUSDT Currently trading at $0.44
Buy level: Above $0.43
Stop loss: Below $0.355
TP1: $0.51
TP2: $0.58
TP3: $0.75
TP4: $1.13
Max Leverage 3x
Follow Our Tradingview Account for More Technical Analysis Updates, | Like, Share and Comment Your thoughts
