AAPLApple shares trade in a consolidation zone after solid Q2 results—revenue at $95.4B (+5%), record services growth, and strong margins despite tariff headwinds.
Technically , indicators lean bullish, but resistance near $202–204 poses a short-term barrier. Market reaction to WWDC AI updates and further supply‑chain diversification will be key. On dips toward $196, there’s room for selective buying; if $204–214 breaks decisively, upside toward $235 could unfold . However, the lack of clear AI revenue guidance warrants caution, aligning with Needham’s cautious stance.
AAPL01 trade ideas

AAPL: Update - Key Levels to Watch for Price DevelopmentAAPL: Update - Key Levels to Watch for Price Development
Overall nothing changed and AAPL remains a valuable and strong structure
Apple's stock (AAPL) has been range-bound between $193 and $212.50 for the past two months, repeatedly testing support near $193 on three occasions.
Each time, the price has rebounded strongly, pushing back toward $212.50—the upper boundary of this trading range.
Given this pattern, the likelihood of another move toward $212.50 remains high.
If AAPL successfully breaches $212.50, it could signal a larger bullish breakout, with upside targets at $224.50 and $240, as highlighted in the chart.
You may find more details in the chart!
Thank you and Good Luck!
❤️PS: Please support with a like or comment if you find this analysis useful for your trading day❤️

AAPL death cat bounceAAPL is looking like a technical death cat bounce (0.5 fib retracement).
Targets around $100 probably lower...

AAPL Bulls May Regain Momentum – Price Action Suggest a Bounce 🔍 GEX-Based Options Insight:
* GEX Cluster sits heavy at 204–206, marking a Gamma Wall / Resistance Zone.
* Highest NET GEX levels suggest 205–206 is a magnet if price builds strength.
* IVR: 16.2, IVX is low, indicating cheap premium for call buyers.
* Calls: 0.6% bias, showing a neutral-to-light bullish flow.
🟩 GEX Support: 197.5
🟥 PUT Walls: Below 192.5 and 190 (farther from current level)
🧠 Technical View (1H Chart):
* AAPL is pulling back into a demand zone while still respecting the upward channel.
* Just formed a CHoCH, signaling a potential reversal back up.
* Price is sitting on channel support + demand, with a recent BOS confirming bullish structure intact.
* Volume during this pullback is lower than the prior bullish leg—healthy retrace.
🔁 Trading Idea (for calls):
Entry:
🟢 Around 198.5–199 (channel and OB support zone)
Target 1:
📈 201.50 – retest of supply / GEX resistance
Target 2:
📈 204.88–206 – Gamma Wall target
Stop Loss:
🔴 Below 196.50, breaks OB and structure
🎯 Ideal Option Play:
* July 5th or July 12th 202 Calls
* Low IV makes this a decent R/R for directional play
* Momentum confirmation on reclaim of 200.80 gives confidence
💬 If AAPL can defend the current structure and flip 200.80 intraday, we may see a gamma chase back to 204+.
This analysis is for educational purposes only and not financial advice. Always trade with a plan and proper risk management.

Time to buy? Too much negative press. Buy in Fear- Updated 23/6Apple has been dealing with significant negative press recently, leading to fear and critical perceptions among investors. This situation suggests a common investment principle: in times of fear, you should buy, and in times of greed, you should sell. Consequently, I have taken a considerable long position on Apple.
The flag pattern is almost complete, indicating that a price movement is imminent. I have set my stop loss at $196, with an anticipated profit from a positive breakout expected to exceed $223, representing potential gains of over 10%. There is also further upside potential to surpass $230.
Apple is a strong long-term hold, regardless of current market fluctuations. The company boasts a mature and extensive ecosystem, making it a brand I wouldn't bet against. If you already own Apple products, you likely understand how unlikely it is that you would switch to another brand.
Last Friday's green candle validated the flag pattern, indicating that a breakout is still needed. However, the flag pattern has now shifted to a more bearish formation, which could suggest seller exhaustion and strong support at these price levels. Achieving above 202 USD would be both a positive sign and an indication of strong buyer interest. The Iranian conflict may cause volatility, but my long position is still active, and the upcoming weeks could see a positive breakout >202. Although this flag pattern is typically bearish, I believe Apple is undervalued based on its future potential offerings and this could be a good entry price? As always not financial advice but let me know if you think Apple is going to <170 or >230.
My target sell price is now 271 USD.

Impact on the Dollar and Forex — Artavion AnalyticsThe development of central bank digital currencies (CBDCs) — especially the digital yuan (e-CNY) — is becoming a key factor in transforming global currency flows. While the US dollar still dominates, the architecture of global liquidity is beginning to shift.
At Artavion, we see the e-CNY not just as a technological experiment but as a tool of China’s currency policy. Its goal is to strengthen the yuan’s role in international settlements and reduce dependence on the dollar, particularly in developing regions.
Why the Digital Yuan Matters
The e-CNY is already being used in China for retail payments and is being tested in cross-border transactions (e.g., in the mBridge project with the UAE and Thailand). This enables the creation of alternative payment systems not tied to SWIFT.
If the digital yuan gains broader acceptance, especially for commodity and energy settlements, its role in forex will grow, potentially weakening the dollar’s monopoly in certain regions.
CBDCs and Forex Structure
CBDCs won’t displace the dollar in the near term, but they are already influencing the structure of currency trading:
New currency pairs are emerging, especially in Asia;
Transactions are becoming faster and cheaper, particularly in the B2B segment;
Market participants are adjusting strategies to real-time settlements and the potential programmability of currencies.
Risks and Limitations
Privacy: CBDCs are under full state control;
Fragmentation: There is no unified technical standard across different countries’ CBDCs;
Geopolitics: The rise of the e-CNY could intensify currency competition with the dollar.
Artavion’s Conclusion
The digital yuan will not replace the dollar, but it is creating an alternative — especially in regions seeking autonomy from Western financial infrastructure. For traders and investors, this means reassessing currency risks and exploring new opportunities in decentralized settlement channels.

Fintech or Government Regulation? — A Perspective from MacromicsStablecoins have evolved from a supplementary tool into a cornerstone of the digital economy. They are used in DeFi, cross-border settlements, and provide liquidity in crypto markets. Today, the question is not whether stablecoins are needed, but who will control them — private fintech companies or government regulators.
Fintech: Flexibility, Speed, Innovation
Projects like USDC, USDT, and Paxos have demonstrated that private companies are capable of launching robust digital assets, quickly adapting them to markets, APIs, wallets, and decentralized platforms.
Advantages:
24/7 availability;
Operational independence;
Flexible integration architecture.
The downside is legal uncertainty. Without licenses and oversight, issuers are exposed to regulatory risk.
Government Pressure and CBDCs
The US, EU, and China are moving toward tight control over stablecoin issuance. The EU has adopted the MiCA regulation, while the US is discussing mandatory licensing of issuers. China and India are betting exclusively on CBDCs, banning private stablecoins altogether.
While CBDCs currently lack the flexibility of private solutions, they offer an alternative for the public sector and B2B settlements.

Forex Market: Myth or Strategy? — Analysis by Valtrix GroupEvery year in June, forex traders pay close attention to historical price movements, hoping to identify recurring seasonal patterns. But does June really offer a strategic edge, or is it a marketing myth and an overrated idea?
At Valtrix Group, we view seasonality as a secondary but useful filter — especially during periods of low volatility and a lack of macroeconomic catalysts.
What Does History Tell Us?
Historical data on major currency pairs (EUR/USD, USD/JPY, GBP/USD) shows that June often exhibits:
A rise in volatility in the first half of the month — driven by inflation data releases (U.S., EU);
Moderate strengthening of the U.S. dollar, particularly between the FOMC meeting and the quarterly earnings season;
In some years — flat movements caused by low liquidity ahead of the summer holiday season.
However, long-term statistics are mixed. For example, from 2013 to 2023, EUR/USD rose in June in 6 out of 10 years and declined in 4, showing no strong directional bias.
Why Seasonality Doesn’t Always Work
The forex market is driven not only by technicals and statistics but also by macroeconomics, geopolitics, and monetary policy. When major events occur in June (Fed meetings, crises, elections), seasonal patterns can easily be disrupted.
Moreover, algorithmic trading and arbitrage strategies reduce the likelihood of consistent price movements repeating year after year.

Why ETH Is Regaining Investor Focus — Lexenvide OverviewAfter several months of relative stagnation, Ethereum (ETH) has returned to the spotlight for both institutional and retail investors. Since the beginning of June, ETH has strengthened by more than 15%, breaking through key resistance levels and showing signs of renewed momentum.
At Lexenvide, we view ETH’s rise not as a short-term speculation, but as the result of a combination of fundamental drivers, improved technical structure, and growing expectations around infrastructure upgrades.
What’s Driving Renewed Interest in ETH?
Approval of Ethereum ETF in the U.S.
The SEC’s decision to approve a spot Ethereum ETF (expected this summer) has been a key catalyst for renewed interest. Similar to the Bitcoin ETF, it opens the door for institutional capital — including pension and index funds — to enter the Ethereum ecosystem.
Rising Activity in DeFi and Staking
Following the Dencun upgrade in March, network fees have dropped, sparking renewed activity in DeFi protocols, particularly in L2 solutions like Arbitrum and Optimism. At the same time, staking volumes are rising: according to Beacon Chain data, the share of staked ETH is approaching 27%.
Strengthening Market Structure
Amid moderate volatility, ETH is increasingly being seen as the “second digital gold,” especially in the context of a shaky stock market. Token supply reduction via burning (EIP-1559) is also adding upward pressure on price.
Cryptocurrencies in Central Bank in 2025 — Analysis by BITDPSThe global financial architecture is shifting, driven by a dual erosion of trust: from the dollar to gold, and from traditional currencies to digital assets. In 2025, central banks around the world are revising their strategies to include assets once considered alternative — gold and cryptocurrencies.
At BITDPS, we analyze global central bank portfolio decisions and observe that gold and digital assets are no longer viewed as opposites, but as complementary.
Gold: A Safe-Haven Asset Amid Geopolitical Tensions
According to the World Gold Council (WGC), central banks have added over 1,200 tonnes of gold to their reserves since the beginning of 2024 — a record high in recent decades. Key reasons include:
Geopolitical instability;
Erosion of trust in the dollar due to U.S. monetary expansion;
Strengthening of local currencies in emerging economies (India, China, Turkey).
Gold is once again being seen as a neutral and sanction-resistant asset, especially in the face of secondary sanctions and potential exclusion from SWIFT.
Cryptocurrencies: Cautious Integration, Not Ignorance
While Bitcoin and other cryptocurrencies are not yet part of official reserves, some central banks are:
Testing CBDCs inspired by blockchain infrastructure;
Exploring asset tokenization models, including bonds and gold;
Investing in research on digital financial tools for cross-border settlements.
🗨️ “It’s not about buying Bitcoin — it’s about transforming how we think about money,” emphasizes a BITDPS analyst.
BITDPS Conclusion
In 2025, gold is solidifying its role in central bank portfolios as a hedge against political and currency risks. Cryptocurrencies, meanwhile, are emerging as catalysts for digital reform and technological experimentation. Both asset classes are now core components of long-term resilience strategies.

Stabilization or New Growth Wave? — Analysis by Paribas GroupThe launch of spot Bitcoin ETFs and the anticipation of similar approval for Ethereum have been among the key drivers of crypto market growth in the first half of 2025. However, after the initial liquidity inflows, the market has shifted into a sideways consolidation phase. This has investors asking: have we reached the peak, or is the market preparing for its next move?
At Paribas Group, we see the current state as a phase of consolidation — not the end of the cycle. Growth fueled by ETFs is not just a “one-day hype” but a structural change in how investors access crypto assets.
What Have ETFs Brought to the Crypto Market?
With ETF launches in the U.S., followed by expansion into Europe and Asia, cryptocurrencies have, for the first time, gained institutionally regulated access:
Over $15 billion in net inflows into Bitcoin ETFs in the first five months;
New classes of investors — pension funds, insurance firms, asset managers;
Reduced asset volatility amid more stable liquidity.
This is shaping a new investment culture: shifting from short-term speculation to long-term positioning.
Why Has the Market Slowed Down?
Following the initial surge, several developments occurred:
Profit-taking by retail participants;
Capital rotation between Bitcoin and Ethereum in anticipation of an ETH ETF;
Waiting for new catalysts — such as Fed monetary policy, DeFi regulation, and ETF rollouts in Asia.
🗨️ “Market silence is not weakness — it’s a phase of accumulation,” notes a Paribas Group analyst.
Paribas Group Conclusion
We expect a second wave of crypto market growth in the second half of 2025, provided the following factors align:
Approval of an Ethereum ETF and rising institutional interest in altcoins;
Easing of monetary policy;
Progress in the legal framework for DeFi and asset tokenization.

AAPL Daily – Key Breakout Zone AheadWe're currently sitting at the lower boundary of a large descending channel on AAPL in the daily timeframe.
After completing what appears to be a 5-wave Elliott bearish structure, the price made a strong bullish rebound. Since then, it has been consolidating in a mid-range zone, forming an ascending triangle, which could signal a continuation of the recent bullish move.
At the current price level, we can identify two key bullish patterns:
An ascending wedge (or "púa")
An ascending triangle
Both patterns are developing around the 0.78 Fibonacci retracement level of the last major bearish impulse — a critical zone. A breakout above this level could imply structural damage to the previous downtrend and open the door to a potential long setup.
🎯 Target zone: 232.00 – 235.00
Keep an eye on volume and breakout confirmation.

AppleNo change in regard to my Apple analysis. I am still waiting for price to either break down to the target box or head straight to the upper target box from here. I think given the current price action we have a higher probability of moving lower first, but the fact remains it is not required. This week will hopefully bring some needed clarity. Regardless of what happens, I believe we're within minor B. It is only a matter of what pathway price takes to get to its end destination.

AAPL at a Key Breakout Zone! Can Bulls Hold This Level?🔍 Technical Analysis Overview (Daily + 1H)
Apple (AAPL) just printed a powerful bullish candle, reclaiming $201 with strong volume. This move broke above recent consolidation and swept minor liquidity under $196 before reclaiming key levels. From a Smart Money Concepts (SMC) lens, we’ve confirmed a bullish CHoCH and BOS (Break of Structure), with price now entering a potential supply zone.
* Trend: Short-term reversal to the upside.
* Volume: Strong breakout volume supports bullish continuation.
* Liquidity Sweep: Price swept lows around $195 and reclaimed — a classic SMC setup.
* Rejection Watch: Overhead supply around $202–$204 is the next test zone.
🧠 Key Levels to Watch
* Resistance Zones:
* $202.5 → GEX3rd CALL Wall
* $204 → Highest positive NetGamma / Call Bias
* $207.5 → GEX2
* Support Zones:
* $197.5 → GEX9
* $192 → HVL + 50% Zone
* $190 → GEX Put Support
* $185 → 3rd Put Wall
⚙️ Options Sentiment (GEX Analysis)
* 📈 GEX Tilt: Call walls dominating from $200 → $210.
* 🧲 Gamma Magnet: $202–$205 could act as a magnet zone short-term.
* ❗ Volatility: IV Rank at 21 and IV% below avg = room to expand.
* 🛡️ Put Protection: Strong GEX support around $190–$192 — buyers stepped in here.
🔄 Intraday Outlook (1H Chart)
Price already filled the green demand zone (~$195–$197), swept key liquidity, and confirmed CHoCH. The strong bullish engulfing candle closed above the descending trendline and is now entering the supply zone marked in red.
* 📌 Possible Scenarios:
* Bullish: If price reclaims and holds above $201.30 → watch for $204–$205 squeeze.
* Bearish: Rejection at $202–$204 and loss of $200 could push us back to $197 retest.
🔁 Scalping Levels
* Breakout Long Trigger: Above $202.5
* 🎯 Target: $204.5 → $207
* ❌ Stop: Below $200.3
* Short-term Reversal Short: From $203.5–204 zone
* 🎯 Target: $200.5 then $198
* ❌ Stop: Above $205
🎯 Swing Trade Plan
* Entry: $200.50–201.00 zone (hold retest)
* Stop: $196.5
* Target:
* TP1 = $204.5
* TP2 = $207.5
* TP3 = $210
🧠 Final Thoughts
AAPL is entering a high-confluence zone both technically and via options data. If bulls hold above $200, there’s a strong chance we tag $204+ soon. But keep in mind — heavy resistance above may cause choppiness. Ideal strategy? Trail stops tight and scale out into GEX walls.
Disclaimer: This analysis is for educational purposes only and does not constitute financial advice. Always do your own research and manage your risk.

APPLE The Target Is DOWN! SELL!
My dear friends,
APPLE looks like it will make a good move, and here are the details:
The market is trading on 200.92 pivot level.
Bias - Bearish
Technical Indicators: Supper Trend generates a clear short signal while Pivot Point HL is currently determining the overall Bearish trend of the market.
Goal - 198.42
About Used Indicators:
Pivot points are a great way to identify areas of support and resistance, but they work best when combined with other kinds of technical analysis
Disclosure: I am part of Trade Nation's Influencer program and receive a monthly fee for using their TradingView charts in my analysis.
———————————
WISH YOU ALL LUCK

Here Comes the Best time to Accumulate $NASDAQ:AAPL ! NASDAQ:AAPL
TIme To Get into it.
Try to accumulate the Stock at level between 190- Current price
Growth is Inevitable.
Nasdaq is Out Smarting the Eleites.

Is Apple setting up for a move? Liquidity sweep + FVGWe're keeping a close eye on Apple (AAPL) after a clear liquidity sweep around $198.40 and $198.70. Although the overall trend remains weakly bearish, the technical elements of the VEP Trader strategy are starting to align for a potential setup — if the market reacts from this institutional zone.
🔎 VEP Context:
Weak bearish trend confirmed via Squeeze Momentum on the 1D chart.
Clean sweep of prior liquidity zones.
Price enters a 15-minute Fair Value Gap, putting us on alert for a possible reversal.
🛠️ Setup Under Watch:
Potential Entry: above $198.70 (inside 15m FVG)
Suggested Stop Loss: above $200.00
TP1: $195.15
TP2: $193.25
👉 No confirmation yet, but if a new FVG forms and Squeeze confirms direction on the 5M or 2M, this may evolve into a clean bearish play.
✅ Key Confluences
Element Current Status
Liquidity Swept ✅
FVG Active on 15m 🟧
Trend Weak bearish 🟡
Confirmation Still pending 🔄
🧠 Final Thoughts
We don’t trade emotions — we trade structure. If momentum aligns and structure forms, AAPL may provide a clean, technical opportunity with solid R:R.
Watching for institutional reaction.

APPLE Trading Opportunity! BUY!
My dear followers,
This is my opinion on the APPLE next move:
The asset is approaching an important pivot point 196.46
Bias - Bullish
Safe Stop Loss - 193.21
Technical Indicators: Supper Trend generates a clear long signal while Pivot Point HL is currently determining the overall Bullish trend of the market.
Goal - 202.06
About Used Indicators:
For more efficient signals, super-trend is used in combination with other indicators like Pivot Points.
Disclosure: I am part of Trade Nation's Influencer program and receive a monthly fee for using their TradingView charts in my analysis.
———————————
WISH YOU ALL LUCK

APPLE A FRESH APPLE TO BITEThe chart for Apple (NASDAQ: AAPL) shows the following key elements:
Rejection Trends: Marked in red, indicating levels where the price has faced resistance and reversed.
Support Levels: Marked in green, with horizontal support indicated by dotted lines, showing price levels where the stock has historically found buying interest.
Price Targets: Marked with specific values, suggesting potential future price levels based on the analysis.
Guideline: Represented by a dashed line, likely indicating a trend or channel guideline.
RSI and Trends: Displayed at the bottom, with the Relative Strength Index (RSI) and additional trend indicators in colorful lines.
Earnings: Marked with purple dashed lines, highlighting significant earnings dates or periods.
The chart covers a timeframe from mid-2023 to June 20, 2025, with the latest data point at 12:07 AM EDT on June 20, 2025.
Watch out, because there is a price target to 169. Meaning, we need to be careful.
There is also a price target to 280+ which has support of indicators.
Heading into earnings we might see the 215 mark which could see a slight drop to around 205, and then could see a climb over months to 280. Even 300+
Watch the trends, and price targets, if at trend, look to sell or buy depending on if support or resistance.

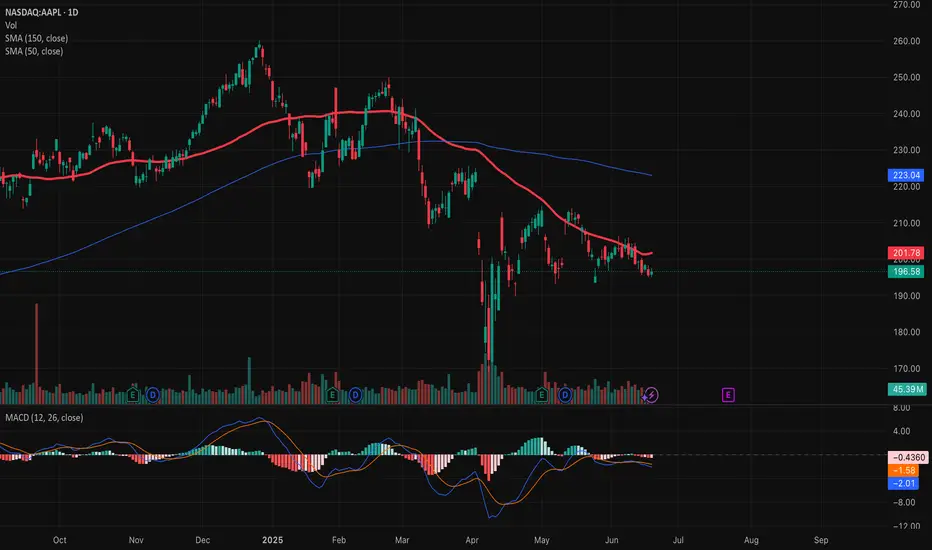
MA chart styleThis is a chart style I need to save. Buy above positive gradient 50 MA and above or close to 150. Confirm with volume and size based on local resistance levels.
Apple Near Key Support — Long Setup DevelopingIntroduction:
Apple NASDAQ:AAPL is approaching a critical support zone that has consistently held over the past two months. As price retraces toward this level, it presents a potential long opportunity for traders looking to position ahead of the next bullish leg.
Technical Setup:
Support Zone: $193 – $196
This area has acted as a strong demand zone, providing multiple bounce points since April.
Price is now pulling back into this region, offering a potential entry for a long trade.
Trade Idea:
Entry: $193 – $196 (on confirmation of support holding)
Take Profit Targets:
First Target: $210 – $215
Second Target: $225 – $233
Stop Loss: Just below $184 (to protect against a breakdown from support)
#AAPL #Apple #Stocks #TechnicalAnalysis #SupportZone #LongSetup #TradingStrategy #NASDAQ #TechStocks #RiskReward

AAPL ema sloping downHeard about Trump's lil phone. Chile...
Well AAPL i aiming for 195 - 193. With this trump phone news, I am thinking it can go lower... toward my blue line. Not all in one day, but not regaining 201 and holding it is not good.
Hoping this posts as I have been having issues publicly posting over the last 2 weeks.

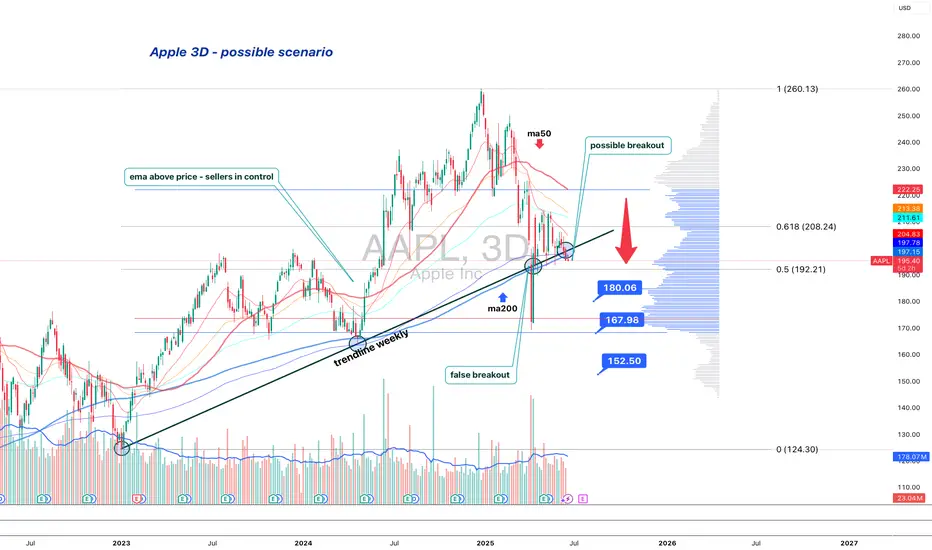
Apple is standing at the edgeApple (AAPL) is losing its long-term structure — second retest of the broken trendline suggests a bearish setup
On the 3D chart, Apple shows signs of structural breakdown. The weekly trendline from 2023 was broken and retested — twice. The price failed to regain it and now trades below, with candles showing weakness: low body closes, upper wicks, and no upside follow-through.
MA200 is now above price, and all EMAs are turning down. Volume Profile shows a heavy resistance block near $197. If the price remains below, sellers are in control.
Key levels:
— $192.20 = 0.5 Fibo support.
— Breakdown ➝ targets: $180 → $167 → $152.
Fundamentals:
Apple's recent reports show decelerating growth, weak China demand, and compressed margins. While AI buzz supports sentiment, institutional flow suggests distribution. BigTech may be topping out, and Apple is positioned for pullback.
Strategy:
Short below $196 with confirmation. Stop: $198. Targets: $180 / $167 / $152.
Failure to reclaim $192–197 = broken trend confirmed.
This is not a growth setup. This is where trends end — and profit-taking begins.