AAPL — Broadening Range and Accumulation Phase. Targeting $300Apple stock has been moving in a broadening pattern for an extended period, showing signs of accumulation. This price behavior suggests a potential bullish breakout. The upside target in the coming months is around $300, possibly by fall or winter. However, a corrective scenario remains on the table, with a potential pullback toward the $165–144 range, which could present a strong long entry opportunity. From a fundamental perspective, investor interest is likely to increase ahead of Apple’s expected product presentation in the fall, which historically supports bullish sentiment in the stock.
AAPL01 trade ideas

AAPL Breaking Structure! Gamma Says Caution — Is $195 Next? 🍎 AAPL Breaking Structure! Gamma Says Caution — Is $195 Next? 🔻
🧬 GEX Options Sentiment Analysis:
* Gamma Key Levels:
* CALL Walls:
* $202.50 (moderate resistance)
* $205 = Gamma Wall / Call Resistance
* $210–215 = Higher walls unlikely to reach short-term without catalyst
* PUT Walls:
* $198 = 2nd PUT Wall and Heavy Volume Level (HVL)
* $195.70 = Highest negative NET GEX / PUT magnet
* Below $195 opens risk to $192.50, $190 (GEX7/10 cluster)
* Options Metrics:
* IVR: 21.6
* IVx avg: 30.2
* PUT Flow: 0% (!!) – no PUT buyers showing up (caution on reversals)
* GEX Sentiment: 🔴🔴🔴🔴 (very bearish tilt)
* Interpretation:
* AAPL is hugging the gamma flip zone at $198–$200. If it breaks and stays under $198, dealers may accelerate hedging, sending it down toward $195/$192.
* Call side is weak; momentum buyers missing.
🧠 15-Minute SMC Structure Breakdown:
* Current Price: $197.18
* Structure:
* CHoCH confirmed just below supply at $198.50 → bearish sign.
* Repeated rejections from the supply zone (pink box).
* Broke ascending wedge/trendline support on rising volume — bearish pattern confirmation.
* Demand box sits near $195.70–$196.50.
* Volume:
* Bearish volume increasing during rejection = potential for trend continuation lower.
⚔️ Trade Scenarios:
🟥 Bearish Breakdown Setup:
* Trigger: Confirmed close below $196.50 with increasing volume.
* Target 1: $195.70 (GEX/SMC demand)
* Target 2: $192.50 (GEX7 magnet)
* Stop-loss: $198.50
Strong confluence with gamma, SMC structure, and volume break = high-probability short.
🟩 Bullish Reversal Setup (Low Probability):
* Trigger: Reclaim of $198.89 with conviction
* Target 1: $200
* Target 2: $202.50 (CALL wall)
* Stop-loss: Below $196.45
Only consider if SPY/QQQ stage reversal bounce and AAPL leads.
💡 My Thoughts:
* AAPL looks weak and vulnerable heading into Tuesday.
* If price loses $196.45, gamma + structure suggests fast flush to $195 and possibly $192.
* This is not the spot to go long blindly — let the level reclaim first.
* PUT flow being 0% despite this setup suggests retail hasn't stepped in — this could change rapidly.
🔚 Conclusion:
AAPL is breaking down from structure and trending toward gamma PUT support. Options sentiment and Smart Money structure are both aligning for bearish continuation — short bounces are sell opportunities unless $199+ is reclaimed with strength.
Disclaimer: This is for educational purposes only. Always manage your risk and follow your plan.
Would you like to format this for a TradingView post next or combine all into one GEX/TA wrap-up?

At monthly supportSymmetrical triangle at a monthly support. Breakout is coming soon, could be either way but I think is most likely to go to the upside following the previous two continuation patterns. Price is just over the lower vertex of the triangle, so we have a tight SL, it triggers if a weekly candles breaks down the triangle. I have calls that expire 3 months from now strike 200. Buying the stock is much safer. Good luck.

Descending Triangle in Apple?Apple has struggled all year, and evidence of a downtrend may be growing in the tech giant.
The first pattern on today’s chart is this month’s lower high relative to mid-May. Combined with the May 7 low of $193.25, some traders may think a descending triangle is taking shape. That’s a potentially bearish formation.
Second, TradeStation data shows that AAPL is the only trillion-dollar company now trading below its 200-day simple moving average (SMA). The 200-day SMA has also turned lower. Those points may confirm long-term price action is less bullish.
Next, prices remaining below the falling 50-day SMA may signal intermediate-term weakness.
Fourth, short-term trends may be weakening: The 8-day exponential moving average (EMA) is below the 21-day EMA and MACD is falling.
Finally, AAPL is one of the most active underliers in the options market. That could help traders take positions with calls and puts.
Check out TradingView's The Leap competition sponsored by TradeStation.
TradeStation has, for decades, advanced the trading industry, providing access to stocks, options and futures. If you're born to trade, we could be for you. See our Overview for more.
Past performance, whether actual or indicated by historical tests of strategies, is no guarantee of future performance or success. There is a possibility that you may sustain a loss equal to or greater than your entire investment regardless of which asset class you trade (equities, options or futures); therefore, you should not invest or risk money that you cannot afford to lose. Online trading is not suitable for all investors. View the document titled Characteristics and Risks of Standardized Options at www.TradeStation.com . Before trading any asset class, customers must read the relevant risk disclosure statements on www.TradeStation.com . System access and trade placement and execution may be delayed or fail due to market volatility and volume, quote delays, system and software errors, Internet traffic, outages and other factors.
Securities and futures trading is offered to self-directed customers by TradeStation Securities, Inc., a broker-dealer registered with the Securities and Exchange Commission and a futures commission merchant licensed with the Commodity Futures Trading Commission). TradeStation Securities is a member of the Financial Industry Regulatory Authority, the National Futures Association, and a number of exchanges.
Options trading is not suitable for all investors. Your TradeStation Securities’ account application to trade options will be considered and approved or disapproved based on all relevant factors, including your trading experience. See www.TradeStation.com . Visit www.TradeStation.com for full details on the costs and fees associated with options.
Margin trading involves risks, and it is important that you fully understand those risks before trading on margin. The Margin Disclosure Statement outlines many of those risks, including that you can lose more funds than you deposit in your margin account; your brokerage firm can force the sale of securities in your account; your brokerage firm can sell your securities without contacting you; and you are not entitled to an extension of time on a margin call. Review the Margin Disclosure Statement at www.TradeStation.com .
TradeStation Securities, Inc. and TradeStation Technologies, Inc. are each wholly owned subsidiaries of TradeStation Group, Inc., both operating, and providing products and services, under the TradeStation brand and trademark. When applying for, or purchasing, accounts, subscriptions, products and services, it is important that you know which company you will be dealing with. Visit www.TradeStation.com for further important information explaining what this means.


#AAPL - Pivot Point: $197.81#AAPL Trading Update — May 29, 2025
Current Price: $201.36
Pivot Point: $197.81
Upside Targets:
1️⃣ $209.99 — First resistance level to watch for profit booking
2️⃣ $216.49 — Confirmation of bullish momentum if price breaks above
3️⃣ $223.50 — Stronger resistance, potential for trend continuation
4️⃣ $230.50 — Longer-term target signaling significant upside potential
Downside Targets:
1️⃣ $185.65 — Immediate support, key level for bulls to defend
2️⃣ $179.13 — A more significant retracement level, watch for bounce or breakdown
3️⃣ $172.13 — Possible floor if selling pressure intensifies
4️⃣ $165.12 — Strong support zone, critical for trend reversal risk
Support Level: $192.17 — Acts as the first buffer zone; a break below could trigger further downside
Resistance Level: $203.49 — Short-term resistance; a clear breakout above this level would open the door to upside targets

APPLE WILL GO UP!Right now, 4th of April I'm standing in APPLE STORE THE GROVE LOS ANGELES
and I'm telling you - the price will turn around ASAP!
That's not financial advice

APPLE: Long Signal with Entry/SL/TP
APPLE
- Classic bullish pattern
- Our team expects retracement
SUGGESTED TRADE:
Swing Trade
Buy APPLE
Entry - 196.46
Stop - 192.63
Take - 203.97
Our Risk - 1%
Start protection of your profits from lower levels
Disclosure: I am part of Trade Nation's Influencer program and receive a monthly fee for using their TradingView charts in my analysis.
❤️ Please, support our work with like & comment! ❤️

Time to buy? Too much negative press. Buy in Fear- Updated 13/6Apple has faced a significant amount of negative press recently, which has created a lot of fear and critical perceptions. This situation indicates that in times of fear, you should buy, and in times of greed, you should sell. As a result, I have taken a substantial long position on Apple.
The flag pattern is nearly complete, suggesting that a move is imminent. My stop loss is set at $196, with an expected profit from a positive breakout at >$223, indicating potential gains of over 10%. There is further upside potential to exceed >$230.
Apple is a strong long-term hold regardless of current fluctuations. It has an extensive and mature ecosystem, and this is not a company I would bet against. If you already own Apple products, you understand how unlikely it is that you would ever switch to something else.

AAPL breakout coming soonWhich way will it squeeze? I share my thoughts if AAPL can hold above 200.
*technically showing caution signs (bearish, but can flip)
*news is affecting the market greatly (esp AAPL re: tarriffs)
*RSI & MACD need a positive signal
*204, 205, 208 immediate targets to be focused on imo
Have a great weekend!

Apple (AAPL) Stock Analysis Apple's stock (AAPL) is currently trading at $201.15, reflecting a modest uptick of 0.47% today. Despite this slight gain, the stock has experienced a 22% decline year-to-date, underperforming its tech peers.
Technical Overview
The stock is navigating a descending broadening pattern, indicating ongoing bearish momentum. Notably, a "death cross" formation occurred in April, where the 50-day moving average crossed below the 200-day moving average, signalling potential further declines.
Support Levels: $193 and $169
Resistance Levels: $215 and $237
A break above the $215 resistance could pave the way for a rally towards $237. Conversely, a drop below the $193 support might lead to a decline towards $169.
Macroeconomic Factors
Recent political developments have introduced volatility. President Trump's proposal of a 25% tariff on iPhones not manufactured in the U.S. has raised concerns. In response, Apple is reportedly shifting a significant portion of its production to India to mitigate potential tariff impacts.
Fundamental Metrics
Market Capitalization: Approximately $3.28 trillion.
Price-to-Earnings (P/E) Ratio: 33.72.
Earnings Per Share (EPS): $6.42.
While Apple's P/E ratio is above its 10-year average, indicating a premium valuation, the company's robust earnings and strategic initiatives continue to attract investor interest.
Conclusion
Apple's stock is at a critical juncture, influenced by technical patterns and macroeconomic factors. Investors should monitor the $215 resistance and $193 support levels closely. A break in either direction could signal the stock's next significant move.

AAPL buygreat stock, been underperforming recently. Good place to accumulate, bottom of trend. I buy lots

APPLE: 3 year Channel Up targets $285.Apple is marginally bearish on its 1D technical outlook (RSI = 43.788, MACD = -0.260, ADX = 30.978) as the recent weakness impeded the price from making the decisive bullish break-out above it. The 1W RSI structure though indicates that this is a bottom formation and it is evident on the Channel Up that the April 7th low has been the start of the new bullish wave. The first bullish wave which also started after a -32% correction, made a first peak on the 1.236 Fibonacci extension. We are bullish on Apple long term, TP = 285.00.
## If you like our free content follow our profile to get more daily ideas. ##
## Comments and likes are greatly appreciated. ##

APPLE Long 200 is very strong resistance.
US-China deal will have a short term positive impact on APPL.

APPLE over 206.35 , 211 ?Apple looks good. WWDC next week could see a pop into the event , anything unexpected could help the stock

AAPL Buycurrently squeezing - i think it could sweep lower liquidity and reverse to the upside. I'd be good with a 20% roi but i could see it going further

AAPL Monthly Support and Resistance Lines for June 2025AAPL Monthly Support and Resistance Lines for June 2025, valid only until the end of June.
Overview:
These purple lines serve as support and resistance levels when the price approaches these lines from either the bottom or top direction. Depending on the price movement direction, traders can enter long or short positions.
Trading Timeframes
I typically utilize 30-minute candlesticks for swing trading options, with a holding period of up to 2-3 days. Additionally, 3-hour or 4-hour timeframes can also be used for swing trades lasting up to 2 weeks to capture significant upward or downward movements.
I post these at the beginning of each month, and they remain valid until the end of that month.

AAPL BUYScenario 1
BUY AAPL at 202.00, riding it back up to 258.00 to 270.00 for Profit Targets, Stop Loss is at 196.00!
Scenario 2
BUY AAPL by setting a BUY LIMIT at 194.00, riding it back up to 258.00 to 270.00 for Profit Targets, Stop Loss is at 189.00!
WARNING: This is only a journal of my opinion of the market and only for my journaling purpose. This information and publication are NOT meant to be, and do not constitute, financial, investment, trading, or other types of advice or recommendations. Trading any market instrument is a risky business, so do your own due diligence, and trade at your own risk. You can loose all of your money and much more.

Time to buy? Too much negative press. Buy in Fear. Apple has faced a significant amount of negative press recently, which has created a lot of fear and critical perceptions. This situation indicates that in times of fear, you should buy, and in times of greed, you should sell. As a result, I have taken a substantial long position on Apple.
The flag pattern is nearly complete, suggesting that a move is imminent. My stop loss is set at $196, with an expected profit from a positive breakout at $223, indicating potential gains of over 10%. There is further upside potential to exceed >$230.
Apple is a strong long-term hold regardless of current fluctuations. It has an extensive and mature ecosystem, and this is not a company I would bet against. If you already own Apple products, you understand how unlikely it is that you would ever switch to something else.

APPLE The Target Is DOWN! SELL!
My dear subscribers,
This is my opinion on the APPLE next move:
The instrument tests an important psychological level 203.93
Bias - Bearish
Technical Indicators: Supper Trend gives a precise Bearish signal, while Pivot Point HL predicts price changes and potential reversals in the market.
Target - 201.90
About Used Indicators:
On the subsequent day, trading above the pivot point is thought to indicate ongoing bullish sentiment, while trading below the pivot point indicates bearish sentiment.
Disclosure: I am part of Trade Nation's Influencer program and receive a monthly fee for using their TradingView charts in my analysis.
———————————
WISH YOU ALL LUCK

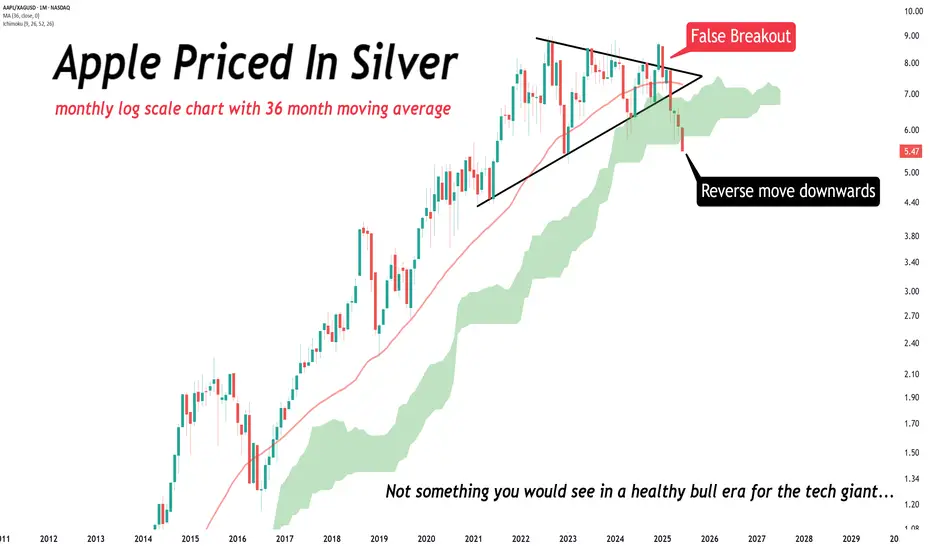
WEALTH TRANSFER IN PROGRESS.WEALTH TRANSFER IN PROGRESS.
The Apple priced in Silver chart indicates reversal from recent highs, with a new longer term downtrend morphing into existence.
The capital rotation tells a story worth watching.
A Apple Stock On the Head And Shoulder MotionAAPL Daily Chart: Head and Shoulders Pattern Confirmed
Apple Inc. (AAPL) has formed a classic head and shoulders pattern on the daily timeframe, signaling a potential reversal from its recent uptrend.
🔍 Key Observations:
Left Shoulder: A peak followed by a pullback.
Head: A higher peak compared to the left shoulder.
Right Shoulder: A peak similar in height to the left shoulder.
Neckline: The support level connecting the troughs between the shoulders and head.
The pattern was confirmed when AAPL closed below the neckline, located around the $220 level. This breakdown suggests a bearish outlook, with a potential downside target of approximately $180, calculated by measuring the vertical distance from the head to the neckline and projecting it downward from the breakout point .
verifiedinvesting.com
📊 Trading Strategy:
Entry: Consider entering a short position upon a confirmed breakdown below the neckline.
Stop Loss: Place a stop loss above the right shoulder to manage risk.
Target: Set a profit target near the $180 level, adjusting based on market conditions.
verifiedinvesting.com
+4
tradingview.com
+4
tradingview.com
+4
⚠️ Risk Management:
Monitor for any bullish reversal patterns or a close above the neckline, as these could invalidate the bearish setup.
Note: This analysis is for informational purposes only and does not constitute trading advice. Always conduct your own research and consult with a financial advisor before making investment decisions.

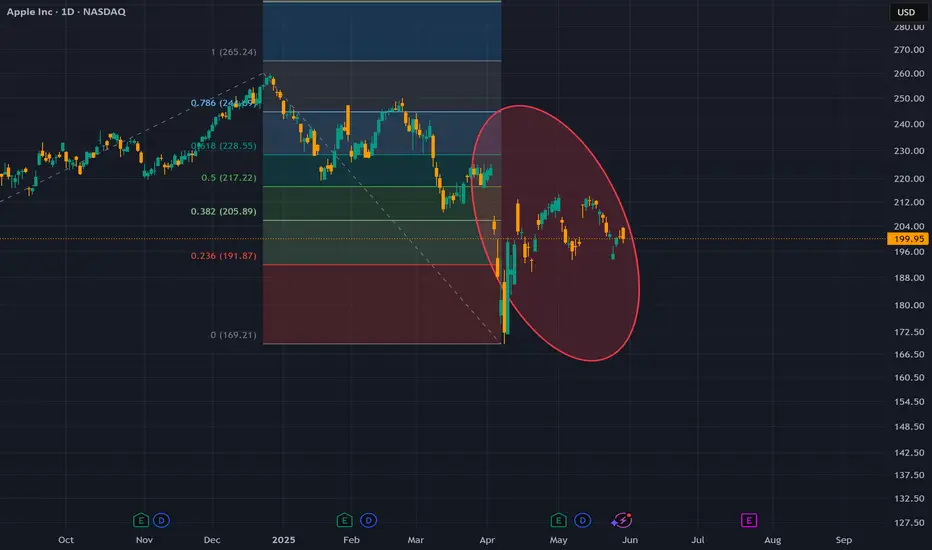
$AAPL – Long Setup Brewing: Fib Break + Gamma Unwind?Not financial advice
Apple has been the last laggard among the Magnificent 7. While others have already reclaimed their weekly 20 MA, NASDAQ:AAPL has spent over seven weeks consolidating just below major resistance, potentially building fuel for a breakout.
The $205 level is the key battleground. It lines up with the .382 Fibonacci retracement from the previous high and acts as a psychological level and gamma pin. Today’s rejection at $205 reinforces its importance. If broken with volume, it could trigger a strong directional move as delta hedging unwinds into upside momentum.
🔍 Technical Outlook:
.382 Fib retracement = $205 → major inflection level
Weekly 20 MA sits just above; price compressing underneath
Bollinger Bands tightening → volatility expansion expected
MACD (weekly) flattening near a bullish cross
CMO rising, showing improving momentum under the surface
📊 Options Flow – 14-Day Snapshot:
Call Volume: $7.87M
Put Volume: $5.37M
→ Volume favors calls
Call Premium: $2.34B
Put Premium: $5.11B
→ Premium skewed toward puts, suggesting larger capital flows hedging downside or playing defense
Open Interest Cluster: Dense between $195–$300, particularly on the call side
Despite the put premium dominance, the consistent call volume and broad OI range suggest accumulation and potential bullish positioning under the surface.
🧭 Trade Thesis:
Apple is coiling at a critical intersection — Fib level, gamma wall, and major moving average resistance. If it breaks $205 with strength, we could see a swift rally toward $215–$225, where the next Fib levels and gamma zones align.
Right now, the setup is compression under pressure. Watching for a clean breakout with confirmation.