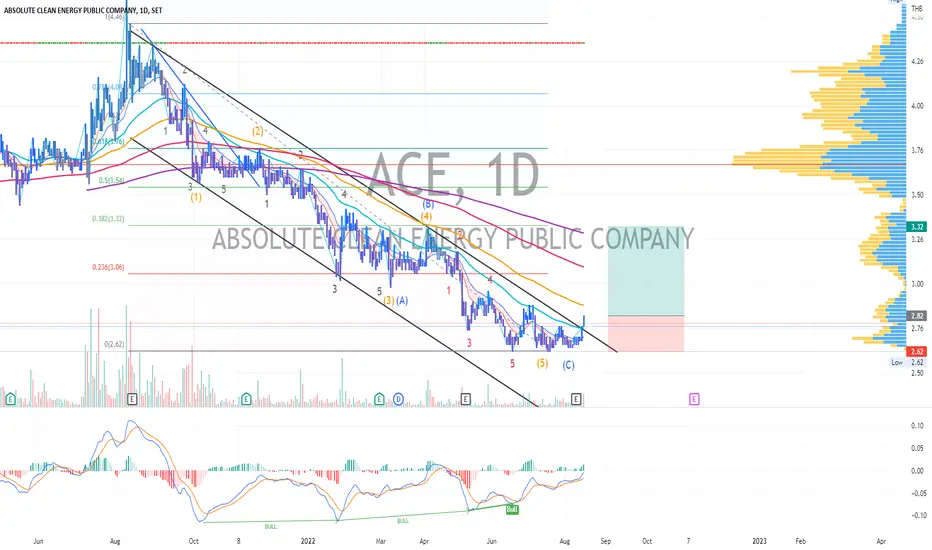
ACE | Elliott Wave Analysis | Triple Bullish DivergencePrice action and chart pattern trading
> Elliott Wave downtrend channel with triple bottom breakout
> Indicator: MACD triple bullish divergence
> Entry @ breakout & pullback support EMA50 zone
> Medium Target @ EMA200 - SMA200 zone 0.382 Fibonacci retracement +17%
> Stoploss @ triple bottom position - 7%
> Risk reward ratio: 2.5:1
ACE trade ideas
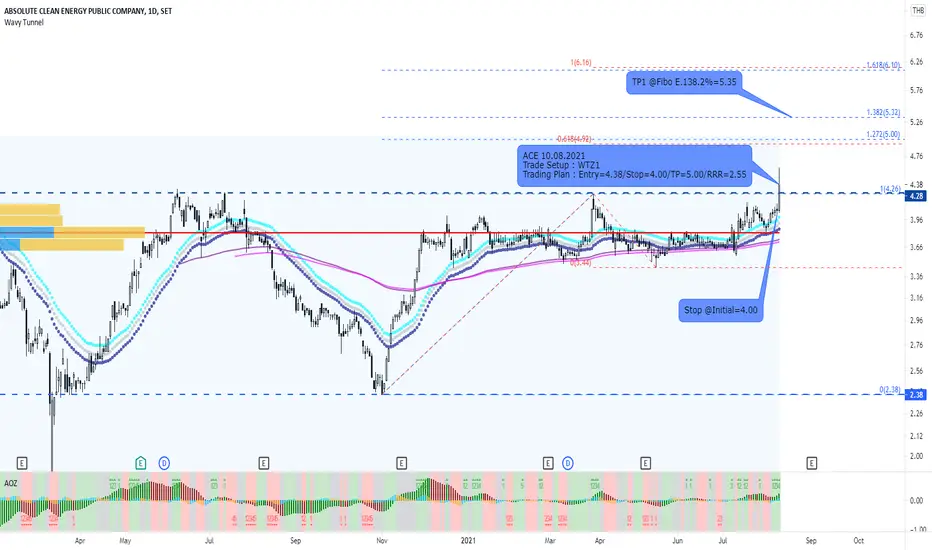
ACE and WTZ1 trade setupACE and WTZ1 trade setup (Break out the trading Range). I expect the the first TP (Fibo E.138.2%). Good Luck
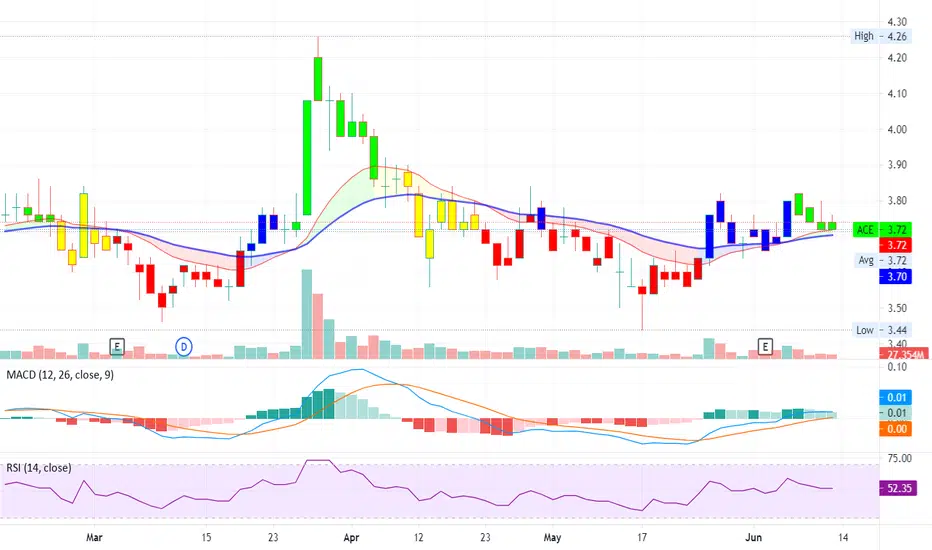

ACE is going down
ACE is long way for the uptrend and now ready to goes down. The stock came to its New Year Resistance and have a very hard time to pass through this wall.
With the Bearish Divergence, Multiple fault Big Volume breakouts and the Weak Momentum in Week graph, the stock could goes down for awhile.
The idea is to just short arond here and stoploss at 3.82 /OR/ wait for the breakdown the blue line at 3.60 and stoploss at 3.74 .
The first target price is its last base at the green line around 3.12
