AMZN – Wedge Complete, Decision Imminent📦 AMZN – Wedge Complete, Decision Imminent
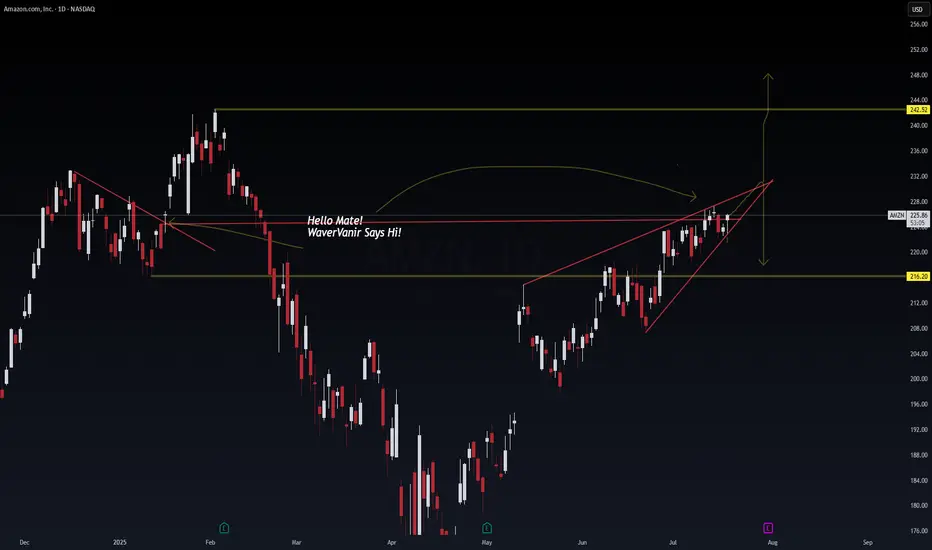
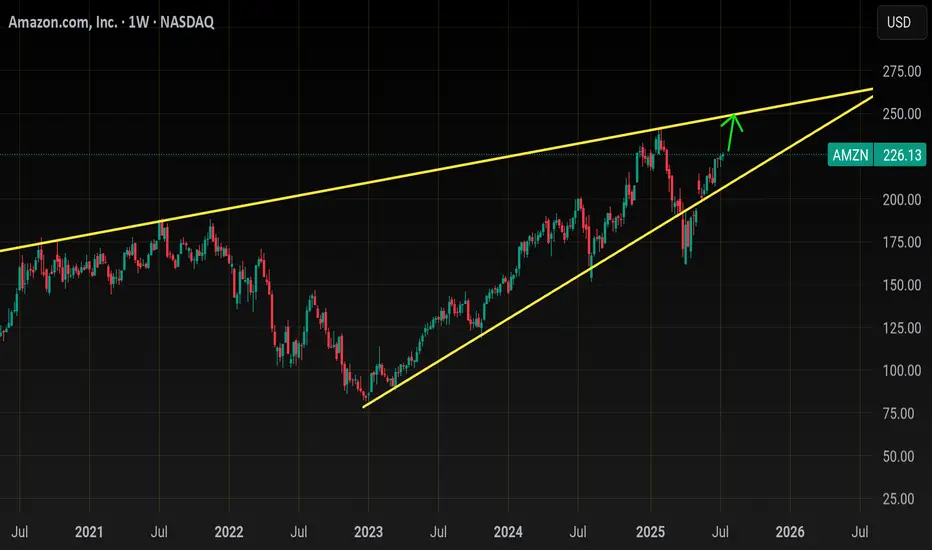
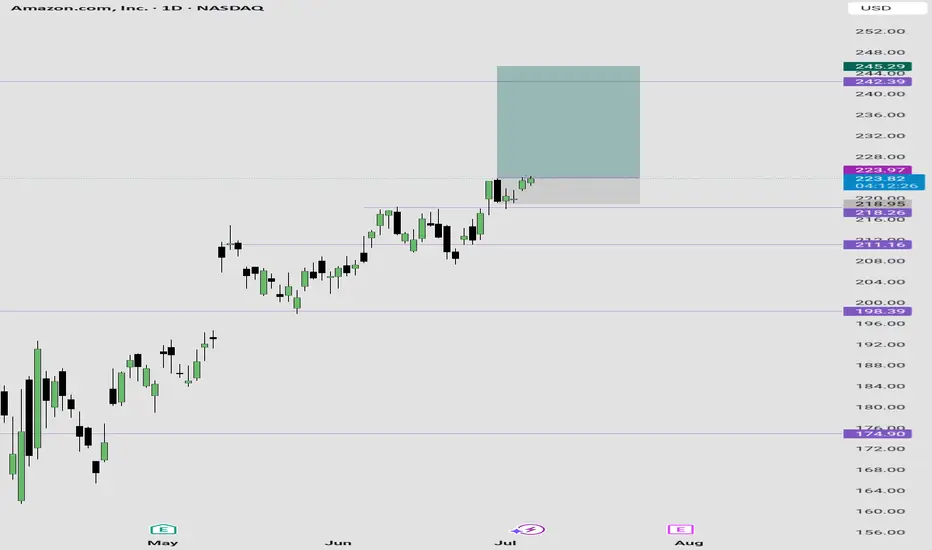
Price action has carved out a clean rising wedge into a known inflection zone. The top of this formation aligns with a macro breakdown level from Q1—likely to attract both breakout chasers and smart sellers.
📍 Key Levels:
Bull Break Target: $242.52
Bear Breakdown Target: $216.20
Decision Point: ~$228
This is a textbook volatility pocket. WaverVanir's DSS signals suggest we're nearing exhaustion. Watch for confirmation before positioning.
⚙️ VolanX Protocol – Predictive AI meets Market Structure.
#AMZN #WaverVanir #VolanX #SmartMoney #TradingView #NASDAQ #WedgePattern
AMZN01 trade ideas
AMZN EARNINGSAMZN price action update:
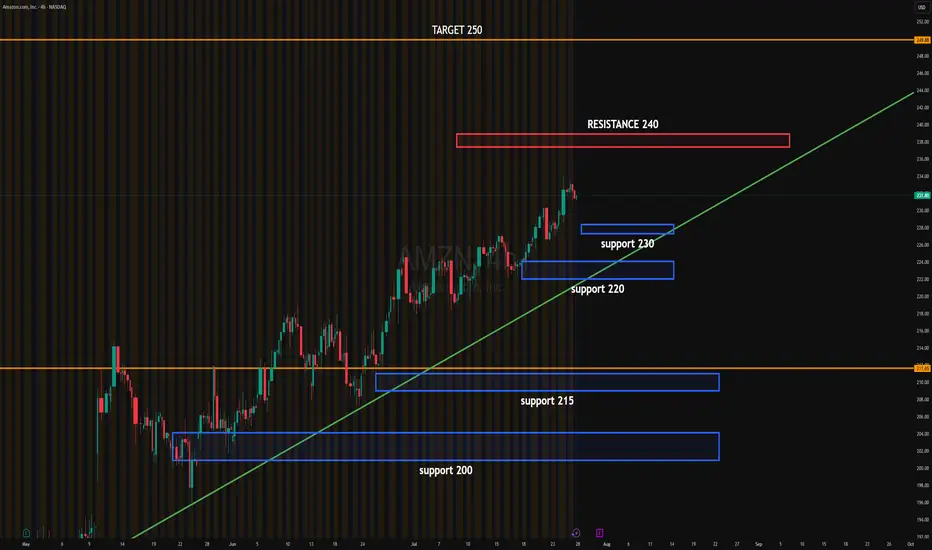
Price is consolidating below the 240 resistance after a steady climb. Buyers are defending the 230 level, showing signs of absorption just above the ascending trendline.
The 233.50 breakout level could trigger momentum towards the 240 resistance. If breached, institutional targets extend toward 250.
Current consolidation suggests the Market Maker is trapping liquidity below 230 while buying time for a directional move.
Upside target: 250
Downside target: 220 if 230 fails
#AMZN #globaltrade #investment #investing #stockmarket #wealth #realestate #markets #economy #finance #money #forex #trading #price #business #currency #blockchain #crypto #cryptocurrency #airdrop #btc #ethereum #ico #altcoin #cryptonews #Bitcoin #ipo
Real Sellers Vs Passive Sellers AMZNHello I am the Cafe Trader.
I was fortunate enough to get an editors pick, and I wanted to expound on how I came to those conclusions.
In this video we talk about passive sellers vs aggressive sellers and how we identify them. Also why it's important to identify these players in the market. This will help give you depth and help you get really good pricing in the markets.
Hope you enjoy the voiceover, Feel free to take a look at the previous article that this was pulled from on my profile.
Please share a boost if you enojoyed, and consider following for more.
Until next time! Happy Trading!!
@thecafetrader

AMZN HEADING INTO AUG 25'SHORT AMAZON
Amazon is current going to retest all time highs.
I want amazon again for a buy in the $209-218 range.
I don't think see Amazon below $208 again.
Going to fail on retest of ATH right now and cool off, bring rsi down back to 50-60 Zone, before consolidating for a break of the all time highs to close out the year.
Amazon always shines in Q4 with Holidays, so expect a great close to the year, but it's an overbought stock right now. (isn't it always??...lol)

Amazon Has a Mixed Technical Picture Heading Into EarningsNext week will see four of the "Magnificent Seven" stocks report quarterly earnings -- Apple NASDAQ:AAPL , Amazon NASDAQ:AMZN , Microsoft NASDAQ:MSFT and Meta Platforms NASDAQ:META . Let's check out AMZN ahead of its results.
Amazon's Fundamental Analysis
FactSet recently reported analysts' consensus view calls for S&P 500 companies to see 9.3% earnings growth for 2025 as a whole, of 9.3%, up from 9% in 2024.
But very interestingly, FactSet also said that earnings growth across the "Magnificent Seven" is projected at 14.1% year over year for just Q2 alone.
By contrast, analysts project just 3.4% y/y earnings gains for the S&P 500's other "Less Than Magnificent 493." That illustrates the Mag-7's impact on the broader market.
As for Amazon, analysts estimate that the e-commerce giant will see $1.32 in Q2 GAAP earnings per share on roughly $162 billion of revenue.
This would represent 4.8% y/y growth from Q2 2024's $1.26 in GAAP EPS, as well as a 9.5% y/y gain from the approximately $148 billion in revenues that AMZN saw in the same period last year.
This has become the norm for Amazon, as revenue growth has landed between 9% and 11% for each of the past four quarters (and is projected to print within that range for the next four quarters as well).
But significantly, of the 34 sell-side analysts that I can find that track AMZN, 27 have reduced their Q2 earnings estimates for the firm since the current quarter began. (The other seven swam upstream and actually boosted their forecasts.)
Amazon's Technical Analysis
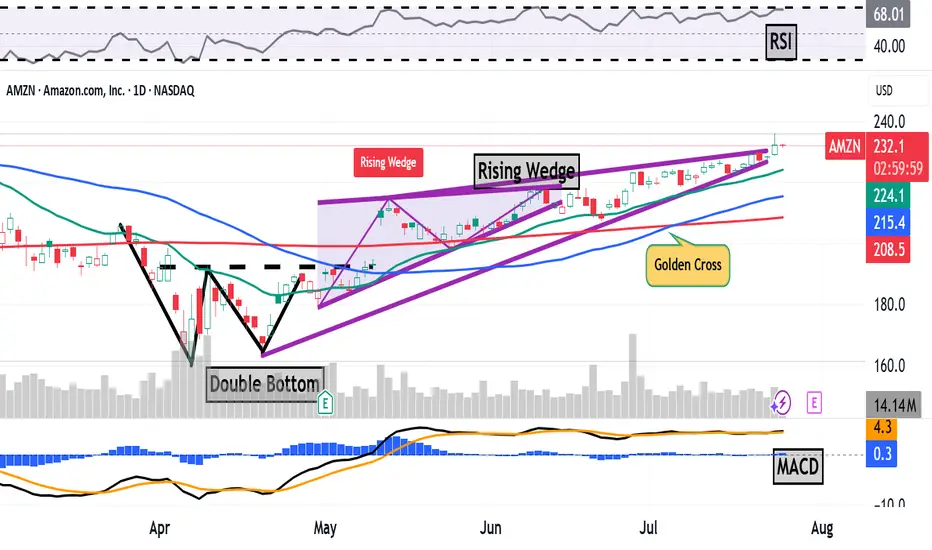
Next, let's look at AMZN's chart going back some six months and running through Tuesday afternoon:
This is an interesting chart, with both positive and negative technical signals.
On the positive side, the stock saw a "double-bottom" pattern of bullish reversal that spanned the month of April, with a $193 pivot (marked "Double Bottom" at the above chart's left).
That produced an upside breakout that appeared to accelerate, with a "golden cross" occurring on July 7 (marked at the chart's right).
A golden cross is generally seen as a bullish technical pattern that occurs when a stock's 50-day Simple Moving Average (or "SMA," denoted with a blue line in the chart) crosses above a rising 200-day SMA (the red line).
There's a catch, though.
While breaking out higher in the chart above, AMZN appeared to develop a "rising-wedge" pattern of bearish reversal, marked with purple diagonal lines in the chart above.
Readers will note that this pattern actually began at the nadir of the double bottom's second bottom in late April. The rising wedge's upper trendline then kicked in on May 13, but the pattern's two lines appear to be closing.
When a wedge closes after two to three touches on each trendline (which we have here), the resultant move can be explosive.
However, it's not necessarily clear which way a stock will move from there -- up or down. A true closing pennant can explode violently in either direction, but as noted above, what we're seeing with Amazon is a pattern of bearish reversal.
This does give me pause about AMZN and makes me more cautious than I might otherwise be about getting involved with the stock ahead of earnings. (I don't currently own any AMZN shares.)
Meanwhile, Amazon's Relative Strength Index (the gray line at the chart's top) looks strong, but nowhere near being technically overbought.
That said, the stock's daily Moving Average Convergence Divergence indicator (or "MACD," marked with black and gold lines and blue bars at the chart's bottom) isn't telling us much at all.
The histogram of Amazon's 9-day Exponential Moving Average (or "EMA," marked with blue bars) is flat-lining right around the zero bound, while the 12-day EMA (black line) is running in line with the 26-day EMA (gold line).
While both lines are running above zero, it matters greatly which one ends up on top. For the short to medium term, the bulls will be rooting for the black line, while the bears will be hoping that the gold line can wind up on top.
(Moomoo Technologies Inc. Markets Commentator Stephen “Sarge” Guilfoyle had no position in AMZN at the time of writing this column.)
This article discusses technical analysis, other approaches, including fundamental analysis, may offer very different views. The examples provided are for illustrative purposes only and are not intended to be reflective of the results you can expect to achieve. Specific security charts used are for illustrative purposes only and are not a recommendation, offer to sell, or a solicitation of an offer to buy any security. Past investment performance does not indicate or guarantee future success. Returns will vary, and all investments carry risks, including loss of principal. This content is also not a research report and is not intended to serve as the basis for any investment decision. The information contained in this article does not purport to be a complete description of the securities, markets, or developments referred to in this material. Moomoo and its affiliates make no representation or warranty as to the article's adequacy, completeness, accuracy or timeliness for any particular purpose of the above content. Furthermore, there is no guarantee that any statements, estimates, price targets, opinions or forecasts provided herein will prove to be correct.
Moomoo is a financial information and trading app offered by Moomoo Technologies Inc. In the U.S., investment products and services on Moomoo are offered by Moomoo Financial Inc., Member FINRA/SIPC.
TradingView is an independent third party not affiliated with Moomoo Financial Inc., Moomoo Technologies Inc., or its affiliates. Moomoo Financial Inc. and its affiliates do not endorse, represent or warrant the completeness and accuracy of the data and information available on the TradingView platform and are not responsible for any services provided by the third-party platform.
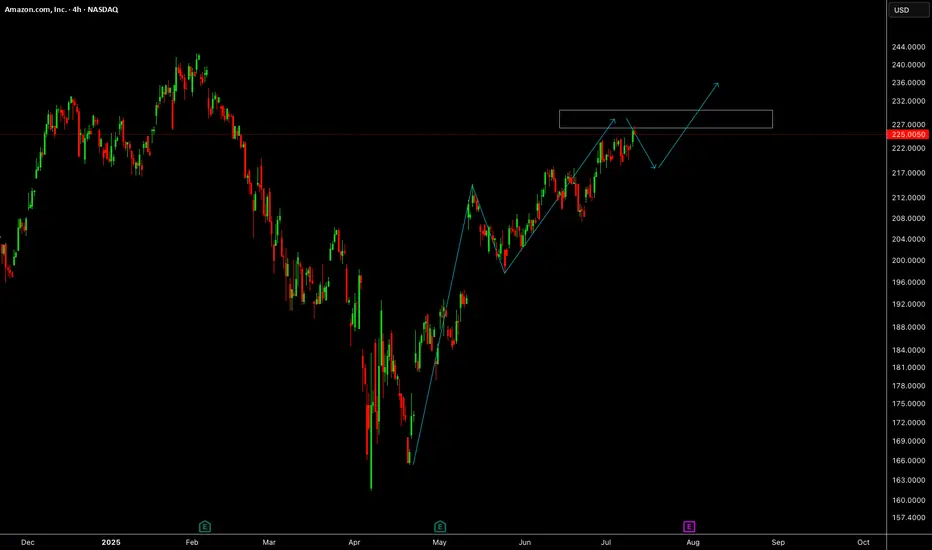
AMZN: Daily Trend Change with Bullish Continuation Setup
🗓 Published: June 26, 2025
📍 Ticker: NASDAQ:AMZN – Amazon.com Inc.
🕒 Timeframes: Daily & 4H
📊 Technical Bias: Bullish
📈 Trend: Higher Highs & Higher Lows
🧠 Analysis Summary
Amazon has successfully reclaimed a bullish market structure on the daily chart by forming higher highs and higher lows since late April. Price is now retesting a key support zone around $209–$212, which aligns with both horizontal support and the rising trendline.
On the 4H chart, the price is stabilizing near the trendline support, offering a high-probability long entry setup if the current structure holds.
📍 Key Levels
Price Level Description
206.28–206.42 Key support zone (invalidation area)
209.06 Local demand area
212.06 Retest level, potential entry
214.76 Local high / minor resistance
219.92 Intermediate target zone
225.22–225.29 Main bullish target / resistance
✅ Trade Setup
Entry Zone:
🔵 Long between $209.00 – $212.00 on confirmation of support
Take Profit Targets:
TP1: $214.76
TP2: $219.92
TP3: $225.22–225.29
Stop Loss:
🔴 Below $206.00 (break of structure + trendline invalidation)
Risk:Reward Potential: ~1:2.5
🔍 Confluence Factors
Daily trendline acting as dynamic support
Demand zone overlap at $209
Volume spike near base, suggesting buyer interest
Higher low formation + potential breakout of local range
⚠️ Risk Note
Only valid if price holds the $209–$212 demand area. If $206.00 is broken with strong bearish candles, the long setup is invalidated and a reassessment is required.
💬 Do you think AMZN will reclaim $225 by earnings? Let me know your outlook!
🚀 Stay patient, follow price structure, and manage your risk properly.
Rendon1

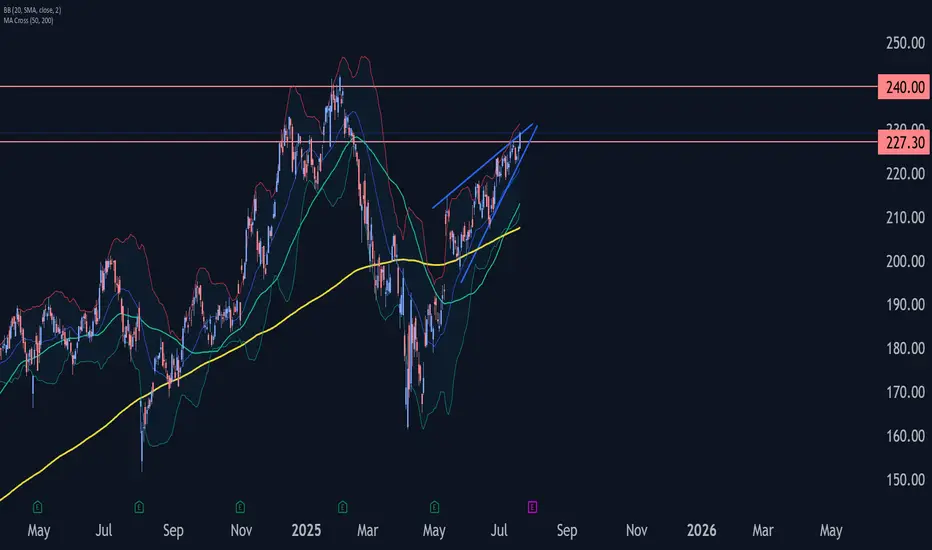
Amazon Wave Analysis – 21 July 2025
- Amazon broke resistance zone
- Likely to rise to resistance 240.00
Amazon recently broke the resistance zone between the resistance level 227.30 (top of the previous impulse wave i) and the resistance trendline of the daily Rising Wedge from May.
The breakout of this resistance zone accelerated the active impulse wave 5 of the intermediate impulse sequence (C) from April.
Given the strength of the active impulse wave 5, Amazon can be expected to rise further to the next resistance level 240.00 (former multi-month high from February and the target price for the completion of the active impulse wave iii).
AmznLooks like 250 is incoming on this stock
V-shape recovery happening in real time
Don't put too much Emphasison this rising wedge in terms of bearishness.. just use it as a range to trade... Will most likely trade inside of it until a catalyst comes to push it to breakout to the upside
Looking for 230 this week
I like any Dips down to 222. Range will be tight so keep that in mind if you are swinging short dated
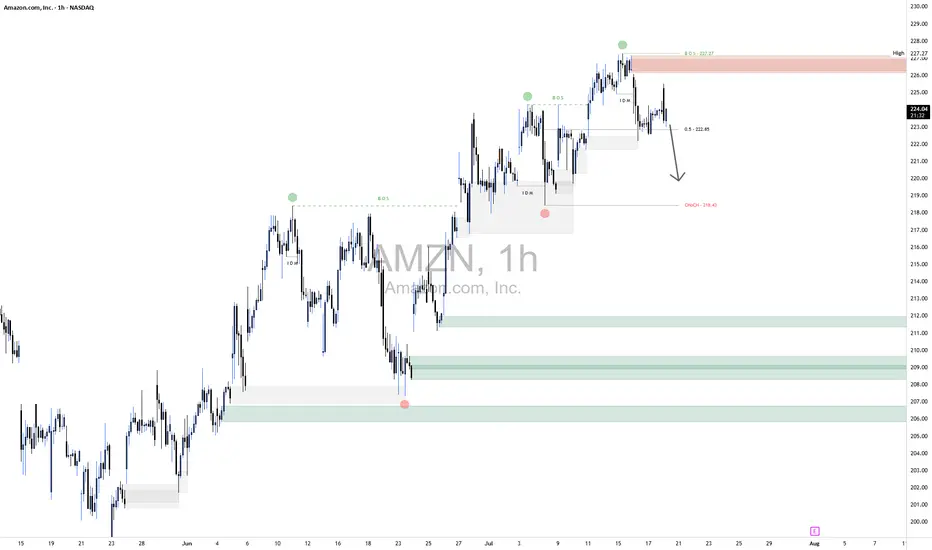
AMZN Short1.Liquidity Landscape
Buy-Side Liquidity Cleared:
Liquidity above the recent swing high was taken — likely triggering breakout traders and stop orders from earlier shorts.
This move appears to be a classic liquidity raid before a reversal.
Sell-Side Liquidity in Focus:
Price is now targeting sell-side liquidity resting below recent higher lows (e.g., below ~222 and especially near 218.50).
This aligns with the direction of your arrow, suggesting price may hunt liquidity pools beneath internal lows.
2. Confirmation via Reaction
The strong rejection from that supply zone confirms no intent to hold price above 227, meaning that was likely a liquidity raid, not a genuine breakout.
Price has already broken below the midpoint (0.5 level at 222.85), adding confidence to the short bias.
3. Liquidity Targets Below
The next likely targets are sell-side liquidity pools resting below:
Around 218.50 (marked zone)
Deeper lows near 211–212, and potentially 208–209, where untouched demand and previous stop clusters lie.
AmazonAmazon needs small correction and further push up towards 235 level.
Disclosure: We are part of Trade Nation's Influencer program and receive a monthly fee for using their TradingView charts in our analysis.
AMZN Ending DiagonalFrom an Elliott Wave point of view, we could be near a downside correction (wave C).
The rise from late May doesn´t have the same momentum, and looks like an ending diagonal.
A break from the bottom of the ascending wedge would indicate wave C is in progress

AMAZON STRONG UPTREND|LONG|
✅AMAZON is going up
Now and the stock made a bullish
Breakout of the key horizontal
Level of 220$ and the breakout
Is confirmed so we are bullish
Biased and we will be expecting
A further bullish move up
LONG🚀
✅Like and subscribe to never miss a new idea!✅
Disclosure: I am part of Trade Nation's Influencer program and receive a monthly fee for using their TradingView charts in my analysis.

Amazon I Strong Bullish Outlook Welcome back! Let me know your thoughts in the comments!
** Amazon Analysis - Listen to video!
We recommend that you keep this pair on your watchlist and enter when the entry criteria of your strategy is met.
Please support this idea with a LIKE and COMMENT if you find it useful and Click "Follow" on our profile if you'd like these trade ideas delivered straight to your email in the future.
Thanks for your continued support!Welcome back! Let me know your thoughts in the comments!

Amazon Long IdeaBuying Amazon shares here...
Reason:
Bouncing off support with good bullish price action candles.
I expect the price to reach $245 per shares between now and next week Friday....
My stop loss price is on the chart.
AMAZON Will Keep Growing! Buy!
Hello,Traders!
AMAZON is trading in an
Uptrend and the stock made
A breakout and retest of the
Key horizontal support
Of 218$ and is going up again
So we are bullish biased
And we will be expecting
A further bullish move up
Buy!
Comment and subscribe to help us grow!
Check out other forecasts below too!
Disclosure: I am part of Trade Nation's Influencer program and receive a monthly fee for using their TradingView charts in my analysis.

APPLE: 1st 1D Golden Cross in 2 years just formed.Apple is bullish on its 1D technical outlook (RSI = 67.490, MACD = 1.760, ADX = 17.850) and yesterday it started forming the first 1D Golden Cross in more than 2 years. This signals the extension of the 2nd major bullish wave of the 3 year Channel Up. The previous one made an incredible extensino to +78.49%. That gives us the target to work with for the rest of the year. The trade is long, TP = $290.
## If you like our free content follow our profile to get more daily ideas. ##
## Comments and likes are greatly appreciated. ##

$AMZN - support at $218.63 . next level at $225AMZN - Stock holding support on the trendline. Stock is also holding flat top support at $218.56. With prime day coming soon, we can see a spike towards to $225 and $230 . decent call flow coming in.

AMZN Short Market Structure Analysis
Break of Structure (BOS)
A bullish run culminated in a BOS to the upside, which typically signals a short-term bullish intent. However, this move acts as a liquidity grab, sweeping buy-side liquidity above the prior high.
Liquidity Sweep & Rejection
Price taps into the higher time frame sell zone, indicated by the shaded red region. The wick into this zone triggers stop-losses from breakout buyers and activates institutional selling interest, leading to a swift rejection.
Inducement & Trap Zones
Several trap zones are clearly mapped out on the descent:
These green areas represent engineered liquidity pockets where buy-side participants are induced to enter prematurely.
As price retraces into these zones, retail traders anticipate reversals, but these retracements serve only to fuel the continuation of the bearish leg.
Lower Liquidity Target (XXX zone)
The chart ultimately projects a move toward the equal lows marked near the $207 level—an area rich in sell-side liquidity. The consistent failure to break lower previously forms a pool of resting liquidity that smart money seeks to exploit.
Liquidity Engineering
The green dots on prior highs mark liquidity collection points—zones where retail buyers are most active.
The higher time frame red zone provides confluence for distribution and is a classic example of liquidity injection followed by reversal.
The step-by-step sell-off shows clear liquidity traps, where short-term demand is absorbed, reinforcing the bearish continuation.
Risk Management Considerations
Stop Placement: Must be placed above liquidity sweep highs and not within internal trap zones to avoid being manipulated out of the trade.
Scaling In: Given the presence of multiple trap zones, one could consider scaling in as price confirms rejection from each zone.
Targeting: A conservative target would be the liquidity void near $207; aggressive traders might look beyond if the structure accelerates.

Amazon getting ready for another leg downAmazon is now in consolidation mode right below the 200MA which also happens to line up with a previous area of resistance. As long as it continues to consolidate below the 200MA, look for another leg down. If it breaks above the 200MA and closes an entire candle above then that would cancel the bearish set up.
Nothing good ever happens below the 200

A Long Trade Opportunity for Next WeekCurrent Price: $223.30
Direction: LONG
Targets:
- T1 = $229
- T2 = $236
Stop Levels:
- S1 = $218
- S2 = $212.57
**Wisdom of Professional Traders:**
This analysis synthesizes insights from thousands of professional traders and market experts, leveraging collective intelligence to identify high-probability trade setups. The wisdom of crowds principle suggests that aggregated market perspectives from experienced professionals often outperform individual forecasts, reducing cognitive biases and highlighting consensus opportunities in AMZN.
**Key Insights:**
Amazon currently exhibits strong upward potential, making it a compelling buy for the upcoming week. Following its bullish market activity and position as a sector leader in technology and consumer discretionary, AMZN faces an environment conducive to breaking through key resistance levels. Additional pullbacks may offer excellent entry opportunities, while upside price targets are well-defined, paving the way for confident trade setups.
The company’s fundamentals remain strong, with an expansive portfolio offering resilience against broader economic pressures. Its leadership in both e-commerce and technological innovation provides a sturdy base for continued investor confidence. Moreover, technical indicators signal bullish continuation patterns, adding further conviction to near-term pricing action predictions.
**Recent Performance:**
Amazon has recently surged past critical resistance zones, reinforced by robust trading volume and bullish price action. Its upward trajectory has outperformed broader market benchmarks, marking a compelling shift in investor sentiment. Last week's breakout performance places AMZN at the forefront of mega-cap technology rallies alongside key competitors such as Alphabet and Meta. This momentum aligns with its broader corporate strategy of innovation and market dominance.
**Expert Analysis:**
Top analysts currently rate Amazon highly for its potential within the near-term trading window. They underscore its favorable technical setup, with momentum indicators flashing bullish signals. Additionally, strategic bets on long-term growth industries, including cloud computing and artificial intelligence, bolster AMZN’s fundamental attractiveness. However, the broader stock market’s volatility should be monitored to mitigate any potential risks from sector-driven pullbacks or negative macroeconomic developments.
**News Impact:**
Recent news about innovations in automation and AI within the tech sector provides supportive momentum for Amazon’s stock price. Positive developments in cross-sector leadership reinforce its bullish sentiment. Similarly, renewed investor appetite for technology stocks boosts AMZN’s prospects, creating favorable tailwinds that could propel shares upward toward noted resistance levels. Any signs of improvement in consumer discretionary spending may further amplify its price rallies moving forward.
**Trading Recommendation:**
Amazon’s robust recent performance and prominent market positioning make it a highly appealing option for long trades in the near term. Its technical structure supports a bullish outlook, with well-defined upside targets and protective downside levels. Traders should wait for minor pullbacks or dips early next week to establish positions, leveraging the stock’s resilience within critical support zones to balance risk while maximizing reward potential.

Profit Raiders’ Guide to Conquering AMAZON Stock!Hello, Wealth Warriors! 🌟
Stock market adventurers, let’s embark on a thrilling quest to dominate AMAZON stock with our cunning Raider Trading Strategy! 🗡️📈 Fueled by razor-sharp technical analysis and robust fundamental insights, this plan targets high-reward zones while dodging market traps. Follow the long-entry map, aim for the golden profit zone, and stay vigilant for overbought signals, consolidation, or bearish ambushes that could shift the trend. 🐻🔍 Secure your gains and celebrate your victory! 🎉
Entry 📈
The treasure chest is wide open! 🏰 Seize the bullish momentum at the current price of $206.02—your adventure begins! For precision, set Buy Limit orders on a 15 or 30-minute chart for pullback entries, targeting a retest of recent highs ($206.69) or lows ($202.19).
Stop Loss 🛑
📍 Place your Raider Stop Loss at the recent swing low ($196.00) on a 4-hour chart for day trades. Adjust based on your risk tolerance, position size, and number of trades to stay in control. 🛡️
Target 🎯
Set your sights on $217.00 or exit early to lock in your profits! 💸 Refer to the finance card above for price trends.
Scalpers, Stay Sharp! 👀
Focus on quick long-side trades. Large accounts? Strike now! Smaller portfolios? Join swing traders for the raid. Use a trailing stop to safeguard your gains as the stock moves. 🧲💰
AMAZON Stock Market Insights 📊
AMAZON is charging bullish, driven by strong fundamentals. 📈 Dive into earnings reports, macroeconomic trends, geopolitical events, market sentiment, sector correlations, and future price projections for a complete view. As of May 28, 2025, at 12:04 AM EST (UTC-5), the stock’s momentum is supported by a market cap of $2.17 trillion and a year-to-date high of $242.52. Stay informed! 🔗
⚠️ Trading Alert: News & Risk Management 📰
Market-moving news can strike fast! Protect your gains:
Avoid opening trades during major news events.
Use trailing stops to secure profits and minimize losses. 🚫
Join the Raid! 💥
Support our battle plan—smash the Boost Button! 🚀 Let’s conquer the market with the Raider Trading Strategy and stack profits like true stock market legends. 💪🤝 Prepare for the next adventure, raiders! 🤑⚔️🎉

AMAZONAMZN needs some more upside before a pullback.
Disclosure: We are part of Trade Nation's Influencer program and receive a monthly fee for using their TradingView charts in our analysis.

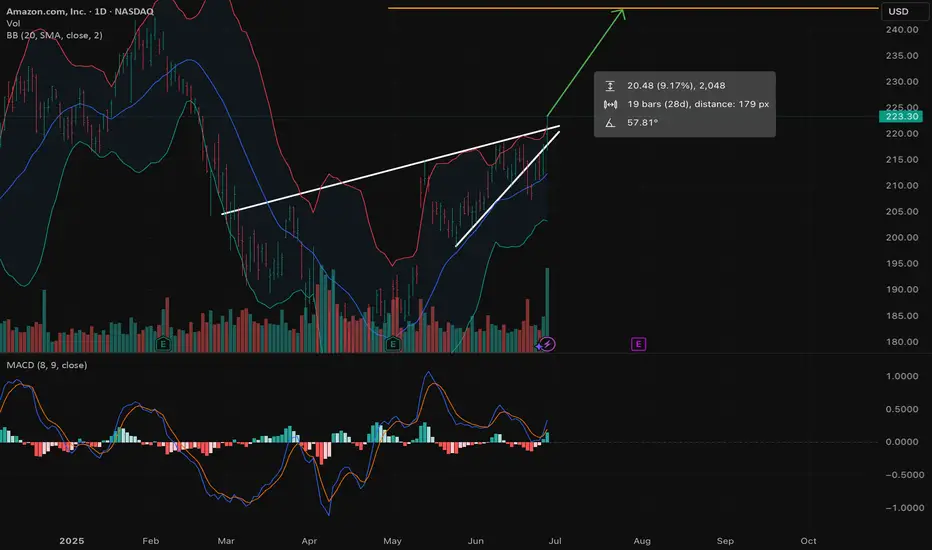
Amazon further upside 10% if no bad newsAs of Friday, June 27, 2025, at 9:09:56 PM PDT, here's an analysis of AMZN:
Current Price & Performance:
Last Price: $223.30 (as of 4:00 PM ET on June 27, 2025)
Today's Change: Up $6.18 (2.85%)
Previous Close: $217.12
Today's Range: Not explicitly available for today's high/low, but recent trading has been within the range of $211.045 to $223.30.
52-Week Range: $144.05 - $228.88
Bollinger Bands (21-Day Timeframe):
To apply Bollinger Bands correctly, we need three components:
21-Day Simple Moving Average (SMA): This is the middle band.
Upper Bollinger Band: 21-Day SMA + (2 * 21-Day Standard Deviation)
Lower Bollinger Band: 21-Day SMA - (2 * 21-Day Standard Deviation)
Based on available data (which provides a 20-day moving average, often a close proxy for 21-day in such analyses, and general band behavior):
21-Day Simple Moving Average (SMA) / Middle Band: The 20-day moving average is around $212.30. Assuming the 21-day SMA is very similar, this will be our median.
Current Price Position: Amazon's current price of $223.30 is above the 21-day SMA/middle band ($212.30).
Where are we - between the median and the upper band or lower band?
Given that the current price ($223.30) is significantly higher than the 21-day SMA/middle band ($212.30), and considering its recent upward momentum, it's highly likely that AMZN is currently trading between the median (21-day SMA) and the upper Bollinger Band.
Interpretation of Bollinger Bands for AMZN:
Price above the middle band: This generally suggests bullish momentum, indicating that the stock is performing stronger than its recent average.
Moving towards the upper band: When the price approaches or touches the upper band, it can sometimes signal that the stock is becoming overbought in the short term, potentially indicating a pullback or consolidation. However, in a strong uptrend, prices can "walk the band" along the upper limit for an extended period.
Bandwidth: While we don't have the exact standard deviation to calculate the precise upper and lower bands, the fact that the price is moving higher and staying above the middle band suggests that volatility might be increasing, and the bands could be expanding.
Recent News & Outlook:
Amazon recently surged by 6.75% in the five trading days ending June 8, 2025, reaching approximately $211.50 per share. (This was a few weeks ago, and the price has continued to climb since).
Analyst consensus targets are generally optimistic, with a median price target around $240.81.
Strong Q1 2025 results with significant revenue and net income growth underscore operational resilience.
Major investments in cloud infrastructure (AWS) and AI development continue to be key growth drivers.
The stock's upward movement is also being influenced by broader market optimism and positive developments like U.S.-China trade talks (from early June).
In summary, based on the 21-day timeframe and the current price action, AMZN is exhibiting strong bullish momentum and is trading within the upper half of its Bollinger Bands.
Important Considerations for Bollinger Bands:
Bollinger Bands are lagging indicators, meaning they reflect past price action.
They are best used in conjunction with other technical indicators and fundamental analysis.
"Walking the band" can occur during strong trends, so touching the upper band doesn't always immediately mean a reversal.
It's important to consider the overall trend and market context.
Remember, this analysis is for informational purposes only and not financial advice. Always conduct your own research and consult with a financial professional before making investment decisions.