ASML from a long term perspectiveASML is a strong company who is planning to build more facilities in the US, I believe they are building one here in my home state of CT. 2,000 - 4,000 jobs could be added. The weekly chart looks great.
Some might see ASML as being richly valued, however it resides in the semi-conductor industry which has been seeing more growth in comparison to other industries.
ASML Fundamentals
P/E - 33
PEG 0.77
EPS 20.61 for the last 12 months
395 million shares (19% held by institutions)
Always pay attention to the float and shares outstanding. Many new investors don't know that companies can just issue more shares when they need money. Called 'raising capital through secondary offerings,' it should be called "Diluting Investors" because that's what it does. Each time this happens your stock is valued lower and lower.
ASML01 trade ideas

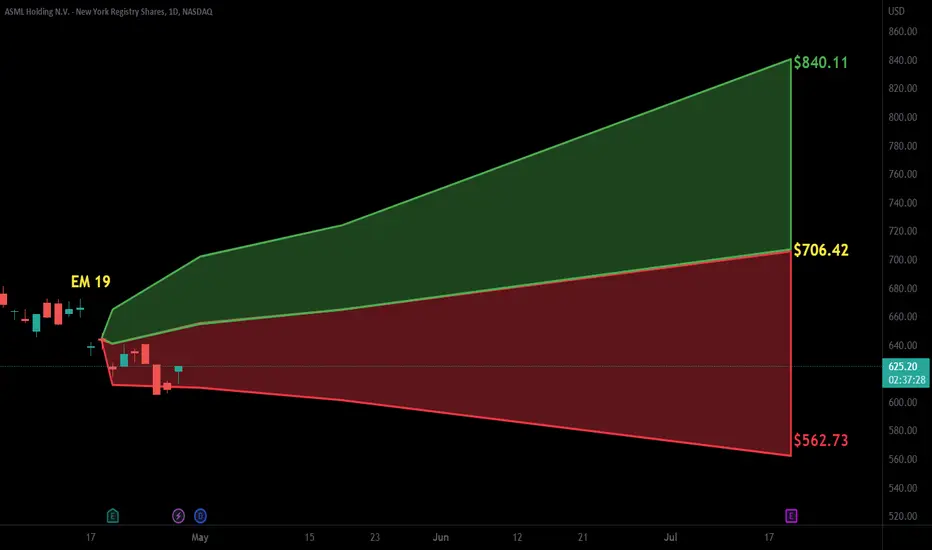
ASML approaching significant supportASML Holding (ASML) approaching a significant zone of support, able to absorb monthly selling pressures.
Currently, there are two dynamics at play for (ASML).
If (ASML) drops into the zone of support, the stock can rotate higher and elicit gains of 20% over the following 3 - 5 months.
Also, there is nearby resistance that if settled above, would also elicit gains of approximately 20% over the following 2 - 3 months.
Inversely, if (ASML) settles on a weekly basis below shown support, this would put (ASML) into a sell signal where losses of 15 - 20% would be expected over the following 3 - 5 months.

ASML Holding Options Ahead of EarningsIf you haven`t sold the top here:
Then analyzing the options chain and the chart patterns of ASML Holding prior to the earnings report this week,
I would consider purchasing the 140usd strike price Calls with
an expiration date of 2023-10-20,
for a premium of approximately $16.
If these options prove to be profitable prior to the earnings release, I would sell at least half of them.
Looking forward to read your opinion about it.

ASML Going Down a SlopeWeekly Chart of ASML
ASML is now in a major Corrective Wave. Waves A and B have been completed. Wave B was a complex WXYXZ wave where Z was a contracting triangle pattern.
Wave C projection is between 100 to 123.6 percent of Wave A. Therefore, ASML may descend to 250 by next year or even lower.

ASML play the bounceHello traders! Today we are going to have a look to ASML chart.
ASML was in an uptrend for a long time but in November 2021 it has started the downtrend.
We expect the price go down to the support line and bounce from there towards the downsloping resistance.
When the price reach the support it is time to enter long position.
Do you agree?
ASML Has Fallen Out of an Upward ChannelASML was trading in an upward channel since November 2022.
Price has broken down the lower trendline of the channel.
A W pattern was in formation in August-September 2023 but ASML wasn't able to break the neckline.
ASML is now at .382 retracement level. If it loses support now, next destination is .5 level - 570.

$ASML with a bullish outlook following its earnings #StocksThe PEAD projected a bullish outlook for NASDAQ:ASML after a negative under reaction following its earnings release placing the stock in drift D with an expected accuracy of 33.33%.

ASML: Bearish Cypher Trend Break Down ConfirmationASML has broken below a trend line and confirmed it with a secondary weaker test and during this test we formed a Bearish Abandoned Baby, some MACD Bearish Divergence, and printed a Bearish PPO Volatility Circle. With all this confirmation at the potential Cypher PCZ, I'd say we have a pretty good chance of this Cypher playing out instead of the deeper .886/1.13 Shark.

ASML Holding Options Ahead of EarningsAnalyzing the options chain of ASML Holding prior to the earnings report this week,
I would consider purchasing the 760usd strike price Puts with
an expiration date of 2023-7-21,
for a premium of approximately $20.55.
If these options prove to be profitable prior to the earnings release, I would sell at least half of them.
Looking forward to read your opinion about it.

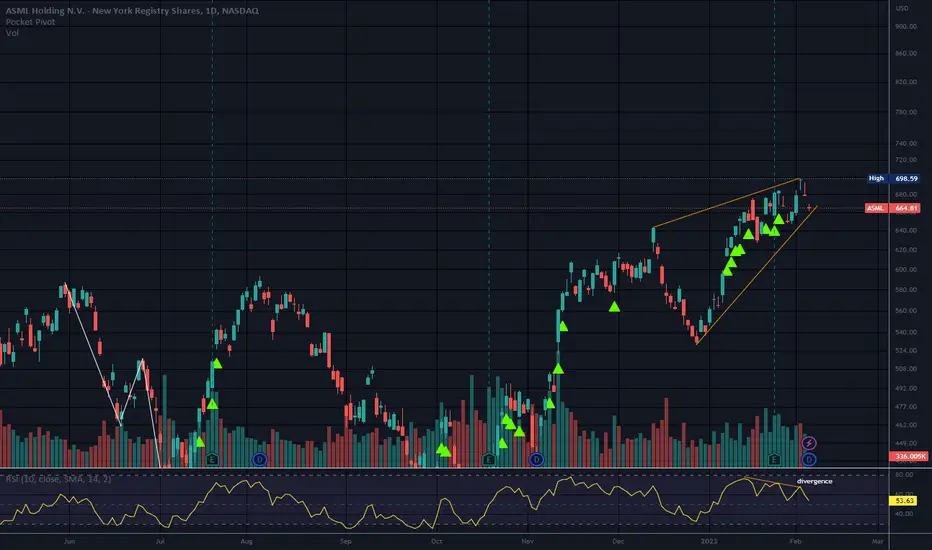
ASML - Rising Trend Channel [MID -TERM]🔹Forming inverse head and shoulders pattern.
🔹Breaking resistance at 793 indicates further rise.
🔹POSITIVE signal from Rectangle formation breakout resistance at 668; Next resistance at 762.
🔹Technically POSITIVE for medium-term long-term.
Chart Pattern;
🔹DT - Double Top | BEARISH | 🔴
🔹DB - Double Bottom | BULLISH | 🟢
🔹HNS - Head & Shoulder | BEARISH | 🔴
🔹REC - Rectangle | 🔵
🔹iHNS - inverse head & Shoulder | BULLISH | 🟢
Verify it first and believe later.
WavePoint ❤️

Bearish Cypher on Weekly Chartlooking for retrace back to B leg of the bearish cypher, possible handle being created for the cup/handle breakout set up on the monthly chart.

ASML - Volatile Rising wedgeon the daily timeframe, the price is approaching the support line of the rising wedge, which, if broken, could indicate a potential drop. Also, note that there's a gap just below the 0.5 of the Fibonacci, which is begging to be filled. A drop to the order block ($550) could result in a bounce. A previously occurring golden cross followed by support found twice on the MA 200 are noteworthy moments: will the price bounce off for a third time? A sustained drop could lead to bullish divergence in the RSI and additional bearish momentum in the MACD if it drops below the midline.
Conclusion:
Based on the weekly and daily charts, signals such as the mostly bearish rising wedge pattern, potential export restrictions to China, potential bearish divergence in the RSI, and the MACD that may cross bearish, suggest that ASML could be facing a potential drop. However, the previous golden cross and the two-time support found on the MA200 also provide hope for potential upward movement.
Keep calm, do your own research! Trade safely and manage your risk.
(Disclaimer: This is not financial advice)

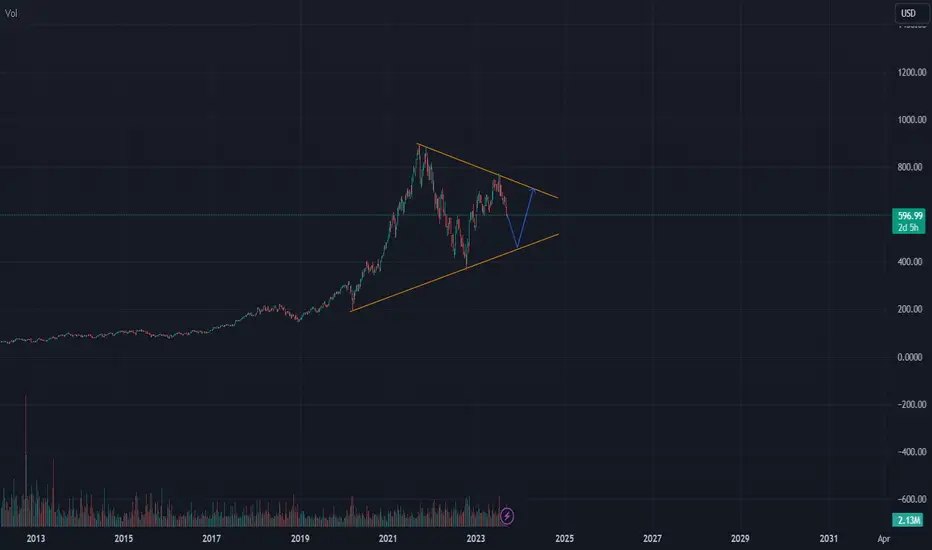
ASML in a volatile rising wedgeLooking at the weekly chart of ASML since January 2021, the price reached an all-time high in November 2021, followed by a downtrend. A bottom formed around €400, with a low point of €372. Regarding the pattern, a W-formation seems more appropriate than a Head and Shoulders pattern, given the left shoulder dips rather deep. The upward trend within a somewhat volatile rising wedge will eventually be put to the test, especially with the looming news about potential export restrictions to China. Should the price rise in a short period of time, and particularly in a straight line upward, possible bearish divergence is something to watch out for. This is especially the case if the RSI surpasses 72.42 and the price stays below €746.8. However, the MACD also suggests an impending bearish cross.
Conclusion:
Based on the weekly and daily charts, signals such as the mostly bearish rising wedge pattern, potential export restrictions to China, potential bearish divergence in the RSI, and the MACD that may cross bearish, suggest that ASML could be facing a potential drop. However, the previous golden cross and the two-time support found on the MA200 also provide hope for potential upward movement.
Keep calm, do your own research! Trade safely and manage your risk.
(Disclaimer: This is not financial advice)

ASML Entry, Volume, Target, StopEntry: with price above 747.14
Volume: with volume greater than 1.41M
Target: 789 area
Stop: Depending on your risk tolerance; 733.20 gets you 3/1 Reward to Risk Ratio.
This swing trade idea is not trade advice and is strictly based on my ideas and technical analysis. No due diligence or fundamental analysis was performed while evaluating this trade idea. Do not take this trade based on my idea, do not follow anyone blindly, do your own analysis and due diligence. I am not a professional trader.

$NASDAQ:ASML swing tradeNASDAQ:ASML swing trade bullish sentiment
Breakout from the Inverse Head and Shoulders

ASML makes the technology that makes semiconductorsASML is shown here on the one-hour chart as having a great quarter with consecutive favorable
earnings It has moved above the blue volume trading range on the profile. The accumulation
distribution indicator shows persistent and high accumulation. The volume heat map shows
recent heat volume spikes. Since ASML has products essential to chip- manufacturing and is the
leader in its field it is very well positioned for the AI boom that is underway according to all
the chatter. ASML is one of the IBD Top 50 tech stocks. If the chart is zoomed out, there is a
rising wedge which might be a bit of bearish bias. Overall, I see this as a long setup worth
buying.

ASML Big Bull Flag breakout may be imminentFlag drawn. Strong volume and green day yesterday.
On close watch for a breakout.

$ASML with a bullish outlook following its earnings #StocksThe PEAD projected a bullish outlook for NASDAQ:ASML after a negative over reaction following its earnings release placing the stock in drift C with an expected accuracy of 71.43%.

ASML: Dominating the industry 💾ASML Holding N.V. is a holding company based in the Netherlands. The Company operates through its subsidiaries in the Netherlands, the United States, Italy, France, Germany, the United Kingdom, Ireland, Belgium, South Korea, Taiwan, Singapore, China, Hong Kong, Japan, Malaysia and Israel. The Company operates through one business segment which is engage in development, production, marketing, sales, upgrading and servicing of advanced semiconductor equipment systems, consisting of lithography, metrology and inspection systems. The Company offers TWINSCAN systems, equipped with lithography system with a mercury lamp as light source (i-line), Krypton Fluoride (KrF) and Argon Fluoride (ArF) light sources for processing wafers for manufacturing environments for which imaging at a small resolution is required. TWINSCAN systems also include immersion lithography systems (TWINSCAN immersion systems).
ASML's lithography systems use a process called photolithography to create intricate patterns on silicon wafers, which are then used to create integrated circuits, memory chips, and other semiconductor components. These patterns are created using a process of etching, deposition, and other techniques that require precise alignment and control.
ASML's customers are primarily semiconductor manufacturers such as Intel, Samsung, TSMC, and GlobalFoundries. These companies use ASML's lithography systems to create the most advanced microchips on the market. ASML's customers are some of the largest and most influential players in the semiconductor industry, and they rely on ASML to provide them with cutting-edge technology that enables them to stay ahead of the competition.
ASML's business model is based on a high degree of innovation and research and development. They invest heavily in R&D to continually improve their technology and maintain their market leadership. Additionally, they operate on a capital-intensive model, where the cost of producing their lithography systems is high but the revenue potential is also significant.
Overall, ASML's business model is centered around developing and selling advanced lithography systems to the world's leading semiconductor manufacturers, which requires a high degree of technological innovation, R&D investment, and capital-intensive production processes.
There are other companies that offer lithography systems for the semiconductor industry, such as Canon, Carl Zeiss, and Ultratech, but they do not directly compete with ASML in the advanced lithography segment of the market. These companies generally offer less advanced lithography systems that are used for less complex microchip manufacturing applications.
ASML's main customers are some of the largest semiconductor manufacturers in the world. These companies use ASML's lithography systems to manufacture advanced semiconductor chips for a wide range of applications, including smartphones, computers, servers, and other electronic devices.
Some of ASML's key customers include:
- TSMC (Taiwan Semiconductor Manufacturing Company)
- Samsung Electronics
- Intel Corporation
- SK Hynix
- Micron Technology
- GlobalFoundries
- UMC (United Microelectronics Corporation)
- STMicroelectronics
- Toshiba Memory Corporation
- Nanya Technology
With the underlying business performing so well over the years, its no surprise to see the stock has followed suit. Since 1996, ASML has returned +23.38% CAGR compared to +9.02% for SPY
At this rate of return HKEX:10 ,000 invested in ASML back in 1996 would have grown to over HKEX:3 million!
The strong market position and outlook for the business make me believe that the company will not be slowing down any time soon, and even at a valuation of 36x earnings I think this is a business trading at a fair value.
I have added this to my portfolio which you can check out here ⬇️
www.etoro.com

Pop then DropExpecting 730-760 over next few weeks (likely 730, 1.27 ext. from prev. move), then drop to low 500s by July

Rising Wedge//RSI DivergenceEarnings estimated to be on 4-15.
Short interest less than 1%.
Price is traveling in a bearish rising wedge. Both trendlines are sloping up and narrowing at the apex. Rising wedges cause an imbalance between supply and demand but are not valid until the bottom trendline is broken. The bottom trendline serves as support until it is broken.
There is also a divergence between price and RSI. It is a bearish divergence. Price slopes up while RSI slopes down.
No recommendation/There is another rising wedge on hourly that would take price below $460 to break the bottom trendline. Neither wedge is valid at this time.
ASML Holding N.V. develops, produces, markets, sells, and services advanced semiconductor equipment systems consisting of lithography, metrology, and inspection related systems for memory and logic chipmakers. The company provides extreme ultraviolet lithography systems; and deep ultraviolet lithography systems comprising immersion and dry lithography solutions to manufacture various range of semiconductor nodes and technologies. It also offers metrology and inspection systems, including YieldStar optical metrology solutions to measure the quality of patterns on the wafers; and HMI e-beam solutions to locate and analyze individual chip defects. In addition, the company provides computational lithography and software solutions to create applications that enhance the setup of the lithography system; and mature products and services that refurbish used lithography equipment and offers associated services. It operates in Japan, South Korea, Singapore, Taiwan, China, the Netherlands, Europe, the United States, and rest of Asia. The company was formerly known as ASM Lithography Holding N.V. and changed its name to ASML Holding N.V. in 2001. ASML Holding N.V. was founded in 1984 and is headquartered in Veldhoven, the Netherlands.
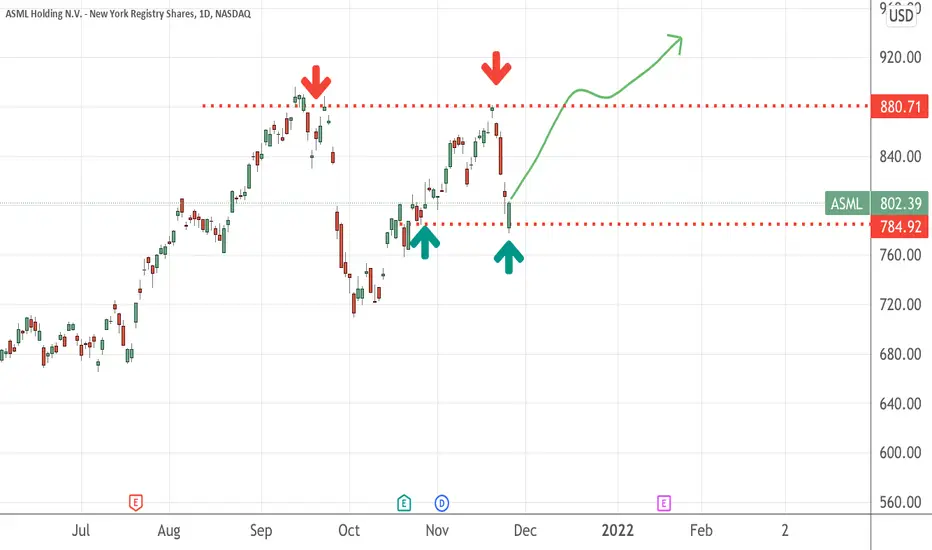
A company with NO competitor I take the recent correction of slightly more than 10% dip from the top is another opportunity to get this stock to break its high!
If nothing forbids its movements, we can see it breaking the resistance level at 880 and make its shareholders happier with a nice Christmas gift !