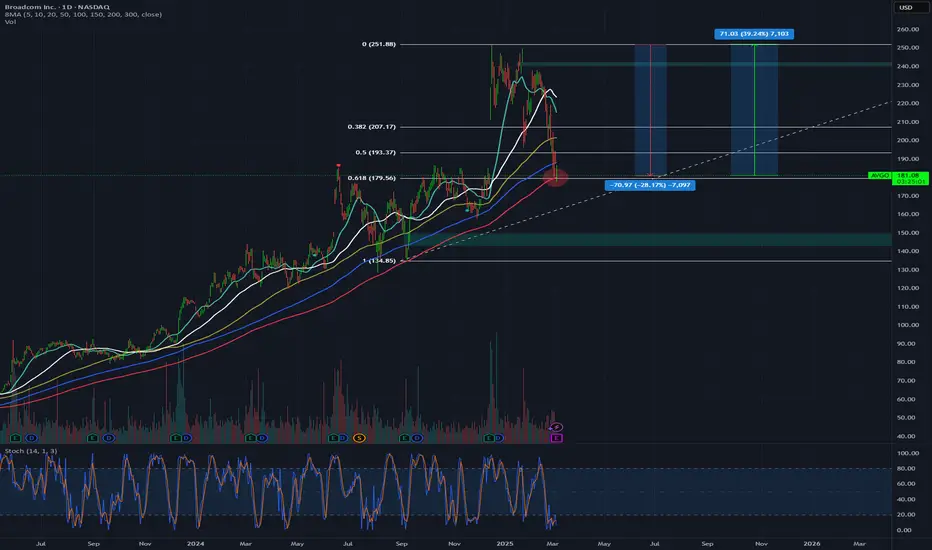
BROADCOM: Is this a legit recovery on the 1D MA200?AVGO is almost neutral on its 1D technical outlook (RSI = 44.867, MACD = -8.280, ADX = 49.944) as it has stabilized following a direct contact with the 1D MA200. That was the first time the price hit that level since the September 9th 2024 low. This is also a technical HL at the bottom of the 9 month Channel Up, while also the 1D RSI is rebounding on its S1 Zone. The Sep 9th 2024 rebound hit its upper R1 level, so our worst case target is 250 (TP1), while the November 27th 2024 low rose by +59.97%, which gives a best case target of 285 (TP2).
## If you like our free content follow our profile to get more daily ideas. ##
## Comments and likes are greatly appreciated. ##
AVGO80 trade ideas

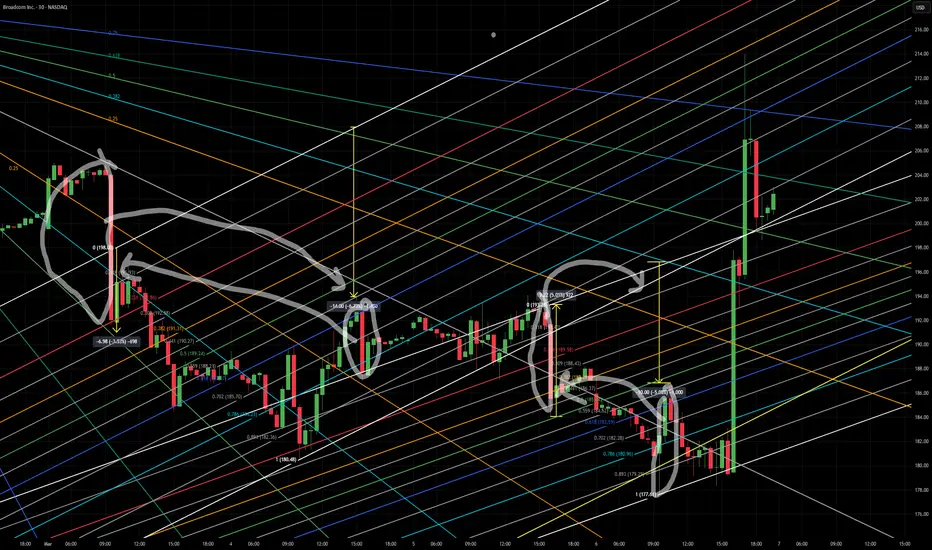
AVGO’s Head & Shoulders Showdown: Bounce or Break Ahead?Alright, let’s zoom into Broadcom (AVGO) on this hourly chart! The stock’s been cruising in a solid uptrend since last August, making some nice gains along the way. But lately, it’s hit a bit of a speed bump, slipping into a corrective wave and forming a clean descending channel. Here’s where it gets juicy—AVGO just carved out a head and shoulders pattern right at the main uptrend line, which also lines up with the support of that descending channel, sitting around $191.40 as of March 13, 2025. That’s a double whammy of support! With the price chilling at this key spot, it’s looking pretty interesting for a potential consolidation or even a price reversal to the upside. The setup’s got some good vibes, so let’s keep an eye on it to see if the bulls step up to the plate!

Pullback in Broadcom Broadcom has trended higher for more than two years, and some traders may see an opportunity in its latest pullback.
The first pattern on today's chart is the June high around $185. The semiconductor company remained below that level through December 13. It then broke out and has now pulled back to bounce at the earlier peaks. Has old resistance become new support?
Second, the rebound occurred after AVGO tested and held its 200-day simple moving average (SMA). That may be consistent with a longer-term uptrend.
Third, the pullback since December may be viewed as a completed A-B-C correction.
Fourth, stochastics are clawing back from an oversold condition.
Finally, AVGO is an active underlier in the options market. That could make some traders look to position for moves with calls and puts.
TradeStation has, for decades, advanced the trading industry, providing access to stocks, options and futures. If you're born to trade, we could be for you. See our Overview for more.
Past performance, whether actual or indicated by historical tests of strategies, is no guarantee of future performance or success. There is a possibility that you may sustain a loss equal to or greater than your entire investment regardless of which asset class you trade (equities, options or futures); therefore, you should not invest or risk money that you cannot afford to lose. Online trading is not suitable for all investors. View the document titled Characteristics and Risks of Standardized Options at www.TradeStation.com . Before trading any asset class, customers must read the relevant risk disclosure statements on www.TradeStation.com . System access and trade placement and execution may be delayed or fail due to market volatility and volume, quote delays, system and software errors, Internet traffic, outages and other factors.
Securities and futures trading is offered to self-directed customers by TradeStation Securities, Inc., a broker-dealer registered with the Securities and Exchange Commission and a futures commission merchant licensed with the Commodity Futures Trading Commission). TradeStation Securities is a member of the Financial Industry Regulatory Authority, the National Futures Association, and a number of exchanges.
Options trading is not suitable for all investors. Your TradeStation Securities’ account application to trade options will be considered and approved or disapproved based on all relevant factors, including your trading experience. See www.TradeStation.com . Visit www.TradeStation.com for full details on the costs and fees associated with options.
Margin trading involves risks, and it is important that you fully understand those risks before trading on margin. The Margin Disclosure Statement outlines many of those risks, including that you can lose more funds than you deposit in your margin account; your brokerage firm can force the sale of securities in your account; your brokerage firm can sell your securities without contacting you; and you are not entitled to an extension of time on a margin call. Review the Margin Disclosure Statement at www.TradeStation.com .
TradeStation Securities, Inc. and TradeStation Technologies, Inc. are each wholly owned subsidiaries of TradeStation Group, Inc., both operating, and providing products and services, under the TradeStation brand and trademark. When applying for, or purchasing, accounts, subscriptions, products and services, it is important that you know which company you will be dealing with. Visit www.TradeStation.com for further important information explaining what this means.

AVGO for buyBroadcom Inc. (NASDAQ: AVGO) has recently demonstrated strong financial performance, driven by significant growth in its AI-related semiconductor business. In the latest quarter, the company reported a 77% year-over-year increase in AI revenue, reaching $4.1 billion, with projections to grow to $4.4 billion in the next quarter.
MARKETWATCH.COM
This surge underscores Broadcom's robust positioning in the rapidly expanding AI sector.
Financial analysts have responded positively to these developments. Citigroup, for instance, maintained its buy rating with a $220 price target, highlighting the strength in Broadcom's AI sector as a counterbalance to potential downsides.
INVESTOPEDIA.COM
Additionally, Broadcom's stock has increased by approximately 33% over the past year, reflecting investor confidence.
However, it's important to consider valuation metrics. According to Zacks Investment Research, Broadcom currently has a Growth Score of B, but its Value Score of F indicates it may be overvalued, suggesting caution for value-focused investors.
ZACKS.COM
In summary, Broadcom's substantial growth in AI-related revenues and positive analyst outlooks present a compelling case for investment. Nonetheless, potential investors should weigh these factors against valuation considerations and align their decisions with individual investment goals and risk tolerance.

Broadcom Inc. (AVGO) Stock Surges Over 8%Broadcom Inc. (AVGO) Stock Surges Over 8%
As shown on the chart, Broadcom Inc. (AVGO) shares soared by more than 8% in Friday’s trading session.
The bullish momentum is driven by strong quarterly results released last week and an optimistic outlook highlighting sustained demand in the artificial intelligence sector:
→ Earnings per share: $1.60 (Analyst forecast: $1.49)
→ Revenue: $14.92 billion (Expected: $14.61 billion), reflecting a 25% increase from $11.96 billion a year earlier.
Technical Analysis of AVGO Stock
The chart indicates that the market remains in an uptrend, with signs that the price has found support at:
→ The lower boundary of the channel.
→ The former resistance zone around $183 – which also aligns with the lower boundary of the price gap that formed in December 2024, as we previously noted.
This suggests that after forming a Bullish Flag pattern (marked in red), the upward trend may continue.
Broadcom (AVGO) Stock Price Forecast
Bank of America analyst Vivek Arya called the results from Broadcom a “reassuring update from an AI leader” and a “positive read-across for AI sentiment.”
According to TipRanks:
→ The average price target for AVGO shares is $248.
→ 27 out of 30 analysts recommend buying AVGO stock.
Trade on TradingView with FXOpen. Consider opening an account and access over 700 markets with tight spreads from 0.0 pips and low commissions from $1.50 per lot.
This article represents the opinion of the Companies operating under the FXOpen brand only. It is not to be construed as an offer, solicitation, or recommendation with respect to products and services provided by the Companies operating under the FXOpen brand, nor is it to be considered financial advice.

$AVGO: Broadcom – AI Chip Powerhouse or Tariff Tightrope?(1/9)
Good morning, crew! ☀️ NASDAQ:AVGO : Broadcom – AI Chip Powerhouse or Tariff Tightrope?
With NASDAQ:AVGO at $194.94 after a Q1 earnings slam dunk, is this semiconductor star riding the AI wave to glory or teetering on trade war woes? Let’s unpack the circuits! 🔍
(2/9) – PRICE PERFORMANCE 📊
• Current Price: $ 194.94 as of Mar 10, 2025 💰
• Q1 2025: Revenue $14.92B (up 23% YoY), EPS $1.60 📏
• Movement: Up 10% post-earnings Mar 6, +8.6% Mar 7 🌟
It’s buzzing like a chip factory on overdrive! ⚡
(3/9) – MARKET POSITION 📈
• Market Cap: ~$93.5B (151.62M shares) 🏆
• Operations: AI chips, software solutions ⏰
• Trend: 42% of 2024 revenue from software, per web data 🎯
A heavyweight in the AI silicon ring! 🌐
(4/9) – KEY DEVELOPMENTS 🔑
• Earnings: Q1 beat with $14.92B, Q2 forecast tops estimates 🔄
• AI Boom: Custom chips fuel hyperscaler demand 🌍
• Sentiment: Shares rallied, per Mar 6-7 posts 📋
Thriving, wired for the future! 💡
(5/9) – RISKS IN FOCUS ⚠️
• Tariffs: Trade uncertainties loom, per web reports 🔍
• Competition: Nvidia, Marvell in the race 📉
• Valuation: Premium pricing raises eyebrows ❄️
High stakes, but risks are on the radar! 🕵️
(6/9) – SWOT: STRENGTHS 💪
• Q1 Win: $14.92B revenue, EPS $1.60 beat 🥇
• AI Edge: 77% AI revenue growth in Q1 📊
• Forecast: Q2 sales outlook shines 🔧
Powered up for the AI era! 🔋
(7/9) – SWOT: WEAKNESSES & OPPORTUNITIES ⚖️
• Weaknesses: Tariff risks, high valuation 📉
• Opportunities: 18% earnings growth projected 📈
Can it outrun trade clouds and soar? 🤔
(8/9) – 📢Broadcom at $194.94, AI chips sizzling—your vibe? 🗳️
• Bullish: $220+ by June, AI rules 🐂
• Neutral: Stable, tariffs balance ⚖️
• Bearish: $170 slide, risks bite 🐻
Drop your pick below! 👇
(9/9) – FINAL TAKEAWAY 🎯
Broadcom’s $14.92B Q1 haul screams AI strength 📈, but tariff shadows hover 🌫️. Volatility’s our sidekick—dips are DCA dynamite 💰. Snap ‘em up, ride the surge! Goldmine or gamble?

The blue pivot point never fails.The blue bullish pivot point signal has reliably indicated a retrace. Bullish momentum in Broadcom AVGO is very likely.

AVGO - SELL at 220Possible Reversal at 220. BUY back at below levels,
Target 1 - 206
Target 2 - 195
Target 3 - 188
Market is too much volatile. Wait for reversal confirmation before enter into trade
Note: This is my analysis and not a recommendation.

AVGO eyes on $192: key Double Fib support to hold Post-EarningsEarnings report gave a spike through Golden Genesis fib at $192.34
That fib is reinforced by a tight confluence with Covid fib at $191.92
This double-fib floor must hold through any post-earnings retrace.
Ideally bulls will push through the red zone at $217.01-220.21.
============================================================
.

AVGO ... Broadcom analysis, if your lost, so am IThis is a funny technique that involves swapping rapid price hikes across different days or parts of days depending on your timeline.
You run a fib from those two top price ranges that were swapped and you get that sea of levels...check the comments as I show more precise pics of how weirdly accurate it can be
cloooose up in 1 min... These weren't made to look good...see my other work, and hit the purple buttons and the Log functions to see how creepy accurate the levels can be:
logged for your pleasure
if people care to know how i get all the things just ask.....enough interest and I can do a video or something here on the many tricks to see how things work
AVGO ..Come and get yah Levels people..created last night
check out that kinda accuracy...
zoom in and if you have question on how i do it...ask.
help to spread this and my other work so more people can try and get money out of the market to be more financially stable and okay...I don't charge anything..and charts and indicators are for all...
happy trading and pass it along if it helped...I don't do socials, so all permissions to broadcast as long at the CyQoTek name is accompanied with it.

Time for a nibbleHitting on Daily MA200 coinciding Fib 0.618. Good entry point to open a new position.
AVGO 50 , 100, 200 DMAAVGO stock with important technical levels.
A "200 DMA" (200-day moving average) is a key technical indicator in stock market analysis, signifying a security's long-term trend by calculating the average closing price over the past 200 days; if a stock is trading above the 200 DMA, it generally indicates an uptrend, while below it suggests a downtrend, making it a valuable tool for identifying potential entry and exit points for long-term investments.

AVGO , 50,100,200 DMAAVGO stock with 3 key indicators , 50,100,200 DMA.
A "200 DMA" (200-day moving average) is a key technical indicator in stock market analysis, signifying a security's long-term trend by calculating the average closing price over the past 200 days; if a stock is trading above the 200 DMA, it generally indicates an uptrend, while below it suggests a downtrend, making it a valuable tool for identifying potential entry and exit points for long-term investments.

3/6/25 - $avgo - #3 semi. it's a buy.3/6/25 :: VROCKSTAR :: NASDAQ:AVGO
#3 semi. it's a buy.
- guys
- this isn't NASDAQ:MRVL
- if NASDAQ:NVDA and NYSE:TSM are S tier... i also like NASDAQ:MU as a supporting actor here (same line of thinking as NYSE:TSM )
- but at 3% fcf yields, 30x PE growing 30%+
- tough to not like this
- let's see what jobz brings tmr, that could determine everything (as a multiplier here)
- so while i'm on the sidelines
- in any other tape i'd go long w you
- "party time, excellent"
- i own NASDAQ:NVDA , NYSE:TSM and NASDAQ:MU which will benefit from this and where i like my R/R better.
- still cash heavy.
- OTC:OBTC at 40%, NASDAQ:NXT at 30% (leveraged 2-1), NASDAQ:NVDA 5% (leveraged 2-1), NASDAQ:MU (leveraged 2-1). cash.
V

AVGO - Can we bounce off of good earnigns?AVGO A Powerhouse Investment Opportunity
Broadcom Inc. has emerged as a standout in the tech industry, demonstrating remarkable resilience and growth potential that makes it a compelling pick for investors. Here are some key highlights that underscore its appeal:
Robust Financial Performance: Broadcom consistently delivers impressive revenue growth and profitability. Its solid balance sheet, high margins, and strategic capital allocation provide investors with confidence in its long-term financial health.
Diverse and Innovative Product Portfolio: With strong positions in semiconductors, enterprise software, and infrastructure solutions, Broadcom benefits from multiple revenue streams. This diversification reduces risk while positioning the company to capitalize on various market trends.
Strategic Acquisitions and Partnerships: Broadcom has a proven track record of making smart acquisitions and forging strategic partnerships. These moves not only expand its technological capabilities but also open up new market opportunities.
Leadership in a High-Demand Industry: As the global demand for high-speed connectivity, cloud computing, and next-generation technologies continues to surge, Broadcom is well-positioned to meet these needs with its cutting-edge solutions.
Investor Confidence: The company’s consistent performance, coupled with its forward-looking strategy, has earned the trust of both institutional and retail investors. Its commitment to innovation and efficiency makes it a stock to watch for long-term growth.
Overall, Broadcom stands out as a reliable and dynamic investment, poised to thrive in the evolving tech landscape. For investors looking to add a resilient, high-performing asset to their portfolio, Broadcom stock is certainly a top contender.
Entry: 191
Target 1 - 219
Target 2 - 244
SL Just below the gap which will serve as our insurance : 176

AVGO Near Critical Reversal – Can Bulls Hold This Level?Technical Analysis (TA):
1. Trend & Structure:
* AVGO remains in a clear downtrend, showing multiple Break of Structure (BOS) events.
* Change of Character (ChoCH) attempts suggest buyers are stepping in, but confirmation is needed.
* Resistance Levels: 194 (Call Resistance), 220-240 (Major Supply Zone).
* Support Levels: 180-187 (Demand Zone & Highest Negative NETGEX).
2. Reversal Zone:
* AVGO is testing a demand zone between 180-187.
* If buyers hold above 187, there is potential for a retest of 194, then 220.
* If price fails below 180, a larger sell-off toward 160-150 is likely.
3. Indicators:
* MACD: Neutral, with slight momentum fading.
* Stochastic RSI: Oversold, indicating potential upside bounce.
* Volume: Recent uptick in buying at support suggests a possible reversal attempt.
Options GEX & Trade Setup:
1. Call Walls (Resistance):
* 194 – First major test for bulls.
* 220-240 – Strong resistance zone if price breaks higher.
2. Put Walls (Support):
* 187 – Highest negative NETGEX, potential bounce area.
* 180-160 – Failure here opens the door for a deeper correction.
3. Option Trade Ideas:
* Bullish Setup: If price stays above 187 and confirms strength, consider April 200C targeting 194-200.
* Bearish Setup: If AVGO breaks below 180, consider March-April 170P targeting 170-160.
Thoughts & Conclusion:
AVGO is sitting at a make-or-break zone. If buyers can hold 187 and push above 194, momentum could shift bullish. However, if sellers reclaim control and price breaks below 180, further downside acceleration is likely.
Disclaimer:
This analysis is for educational purposes only and does not constitute financial advice. Always do your own research and manage risk accordingly.

AVGO Broadcom Options Ahead of EarningsIf you haven`t bought AVGO before the previous earnings:
Now analyzing the options chain and the chart patterns of AVGO Broadcom prior to the earnings report this week,
I would consider purchasing the 190usd strike price Puts with
an expiration date of 2025-3-21,
for a premium of approximately $10.35.
If these options prove to be profitable prior to the earnings release, I would sell at least half of them.

Critical earningsTomorrow Broadcom reports it's earnings after regular trading hours. It will be very interesting to watch, because the share price is near a long term trend line. This trend line coincides with the 200 dma, which adds to the significance of this support. If earnings (and outlook) fail to satisfy the market's expectation, this long term trend can be broken and we can expect a correction to take place. In that case I would expect the price to drop to at least the first Fibonacci level of around 160. However, it can go (much) lower from there.
But, let's first watch the earnings report tomorrow and then decide what to do.

$AVGO almost down 30% Since the AI trade took hold of the S&P and NASDAQ the 2 stocks which we poster child in the AI trade were NASDAQ:NVDA and $AVGO. Out of the 100% of the real AI revenue done by Semis almost 15-20% is attributed to Broadcom $AVGO.
After the last quarter results the stock gapped up more than 20% and reached an ATH of 250 $ from the lows of 170 $. This week the stock almost touched 170 $. The Gap got filled as they usually do. So as usual in the technical patterns world the previous tops become support. The 200 Day SMA is at 178 $. I think between 170 $ and 180 $ is the accumulation zone for $AVGO. Tomorrow, being the earnings date of NASDAQ:AVGO we should watch out for volatility after the earnings. An implied move of +/- 10% in the price of NASDAQ:AVGO can happen after the earnings.
All in all, buy NASDAQ:AVGO between 170 $ - 180 $.

BROADCOM Is this the buy opportunity of the year?Broadcom Inc. (AVGO) has been trading within a multi-year Channel Up since the October 2022 market bottom and broke last week below its 4H MA200 (orange trend-line). In the past +2 years, every time the 4H MA200 broke, the stock was on its most optimal buy opportunity, as long as the 1W MA50 (red trend-line) held.
In fact, it has been holding since the December 09 2022 break-out so as long as it doesn't break now, AVGO is a low risk - high reward buy opportunity. Actually both in 1W RSI terms as pure price action, the current Low resembles the September 06 2024 one, which started the most recent Bullish Leg.
That sequence initially hit its previous Resistance (previous Higher High) before entering a Re-accumulation phase halfway before the Channel Up top. As a result, we expect to see AVGO hitting at least $250 before the next pull-back that quite possible may target $330.
-------------------------------------------------------------------------------
** Please LIKE 👍, FOLLOW ✅, SHARE 🙌 and COMMENT ✍ if you enjoy this idea! Also share your ideas and charts in the comments section below! This is best way to keep it relevant, support us, keep the content here free and allow the idea to reach as many people as possible. **
-------------------------------------------------------------------------------
💸💸💸💸💸💸
👇 👇 👇 👇 👇 👇

Short AVGO via $190 and $191 March 7th PutsShort AVGO to $170 in line with Friday, March 7, 2025, options expiration. Based on upcoming earnings and weekly chart observations.

Broadcom - 290$ or 190$ ?When AVGO shot up after the last earnings it looked a lot like too much of AI hype to me.
Drawing this channel explains the move quite well. With the June high and lows in September and November this channel was established and price took off right to the upper limit.
Since then it has corrected by about 20% but this could fit quite well in a 5-wave move to the upside targeting the 290$ area.
Alternatively price could fall to the 190$ region and invalidate the elliott wave. Depends a lot on market conditions and if we can see another NDX ATH.
