DBS Long Breakout on volume.look to accumulate 30.60 and below.
risk takers consider chase on open 7/7/21
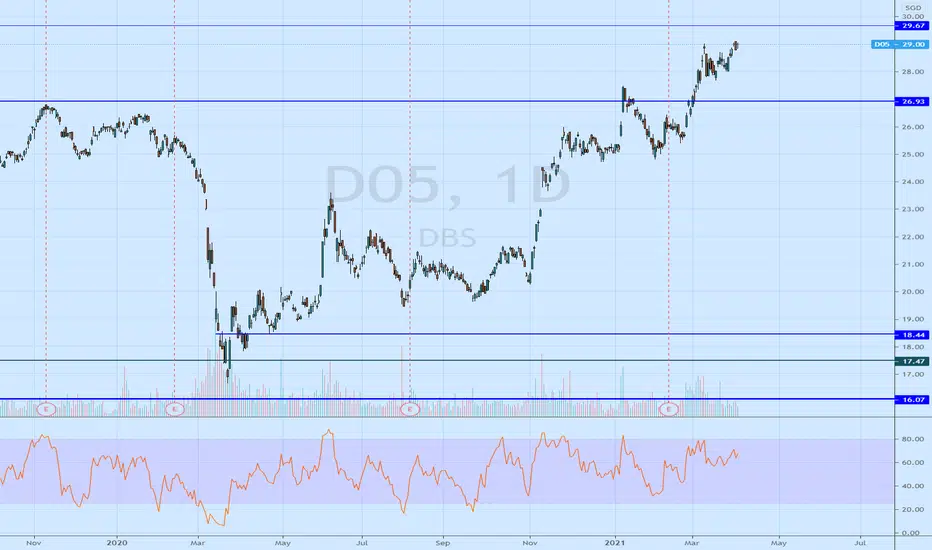
DBS19 trade ideas


DBS also has downside riskDBS, the biggest component of the STI, appears to have great downside risk.
Breaking below support of 29.60, after a lower high, means a lower low is put in place.
The weekly chart already had a Bearish Engulfing last week, and this week (left with 1.25 days) closing down below 29.60 to end the week would be another toppish candlestick pattern called the Three Outside Down pattern. Bad for tops.
MACDs and RPMs look like shite... heads up.
Oh, btw... may be a couple of weeks for this to pan out IF it really breaks down.

DBS is approaching support, potential bounce Prices are approaching support where we could see a bounce here.


DBS is testing a key support level Prices are sitting on a key support level in line with our ascending trend line where we could see a bounce above this level. Ichimoku cloud is showing signs of bullish pressure as well.


DBS, Island reversal? Fret notIsland reversal? Bearish evening star? oh well, just gonna wait for selling and rebuy it at the next lower support

DBS (D05) - Bearish PredictionHumbled, we would like to thanks for your support who has already liked, commented and followed us.
Your support, strengthens us, to help in analyzing the market.
DBS (D05) - Bearish Prediction, be carefull

DBS is facing bearish pressure, potential for further drop Price is approaching resistance where we could see a reversal below this level, a break below our downside confirmation would provide the bearish acceleration to our first support target

SG: DBS ran out of juice...Just saw this weekly chart of DBS (D05)...
After a spectacular and amazing run up, DBS is clearly stalling out and poised to fall a good 10%, maybe more.
Candlestick patterns show a bearish inside candle, fallowed by another that gapped down.
point here is that if this is still remotely bullish, there should be better patterns and signs of strength somewhat.
MACD has stalled and is pretty much turning down.
the RPM and Volume Divergence all convergently signal downside to follow.
Notably, the recent spike broke out of a rising channel, and came back in... as with most pattern analysis, this type of breakout failure warrants a follow through out of the other side.
Bearish looking for DBS expected...
As DBS makes up a significant part of the STI, we can expect the STI to behave similarly too...

DBS is facing bearish pressure, potential for further dropPrice is facing bearish pressure and we could see a reversal below our sell entry here. Ichimoku cloud is showing signs of bearish pressure as well in line with our bearish bias.


Should you sell the bank stocks ?Just search through the internet daily and you would find plenty of trade calls on buy and sell stocks, be it an article, video or podcasts. So, I can understand the confusion for new traders/investors. Who do you really listen to ?
I too, suffered this "blind follow blind leaders" syndrome when I first started, made lots of illogical and silly mistakes that could be avoided but nevertheless it happened. So, like they said, one has to pay tuition money to learn from the market, haha.
My 2cents prediction for DBS bank is it is likely to hit around 30-32 dollars before we see a downturn. That means those who picked up at 16 in March 2020 would benefits the most.
From the chart, we can see the historic patterns of DBS Bank. It is going through a stage of consolidation between 8 to 21 dollars since 1998. This is a long term pattern that we can see and notice it has recently (Nov 2020) breaks out from its long term resistance level at 21.48. So long as the price stays above this level , I am inclined to think the probability of it hitting beyond 30 dollars is higher.
Thus, I hope this gives you more clarity if you should buy or sell this stock. It really depends what kind of time frame you are looking at. Those that are advocating you to sell may not be entirely wrong if they hold a shorter time horizon and those that urged you to go long may be in for the long haul. The question to ask is, which time frame are you looking at ?

DBS is seeing a double top and MA9 cross below MA 50! DBS is seeing a double top and MA9 cross below MA 50, more downside is possible !

DBS is facing bullish pressure Price is facing bullish pressure from our support and a test of our buy entry could present a good opportunity to go long.

DBS on a sunny island... setting into the seaDBS, a big component of the STI (Straits Times Index) finds itself on an island (yellow circle)
This is precarious... a drop below the current support will result in a decent retracement.
MACD and Relative Price Strength already turned down... so it is held up with very little.
Be aware, beware!

Marching on to 26 dollars for DBSFor the patient investors who got in at below 20 dollars, you are rewarded and more to come....


DBS: Triple Tops or Bullish Triangle Breakout?SGX:D05 is in the crossroad, either the Triple Tops will prevail or it will be a bullish breakout.
Based on the current formation, and if we combined with Supply and Demand; it is wiser to wait for Long Setup rather than Shorting it.
As at today there is no LL yet and overall still Buyer in control.
Here is my personal call:
Buy Stop at $21.65
Stop Loss at $21.30
Take Profit at $23.00
Risk Reward Ratio = 3.97R
Potentially, you can buy yourself an iPhone 12 Pro Max 512Gb by end of the year, if you place 1 lot on DBS. Good Luck!
Disclaimer :
The analysis above for educational purposes only, I do not responsible for your losses. Please adjust your own lot-sizing according to your appetite.
If you are benefiting from my trade opinion, please buy me coffee.
As always, move your SL when you are in the profit zone.


DBS Short1) Price attempt to break out 21.55 on 13/10/20 with day high at 21.65
2) Double bottom formation (suppose a bullish reversal pattern) with key Resistance at 21.45
3) MACD Histogram indicate losing momentum
4) RSI fail to stay above 70
5) Fundamentally: quarterly dividend might be a disappointment, usually in Nov.
Short 21.49 - 21.65
Stop loss 21.86
