Nvidia - This is clearly not the end!📐Nvidia ( NASDAQ:NVDA ) will confirm the breakout:
🔎Analysis summary:
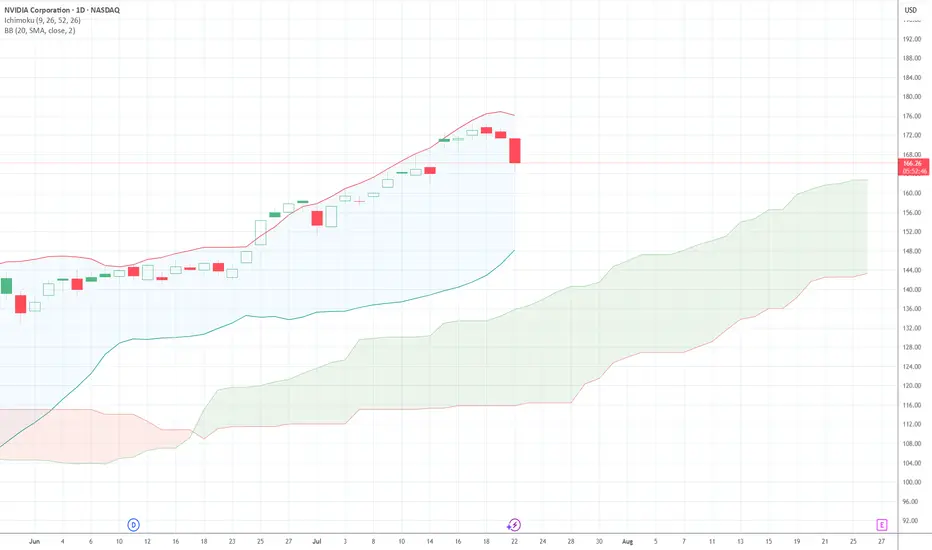
Over the past couple of months, Nvidia managed to rally about +100%, reaching top 1 of total market cap. Most of the time such bullish momentum just continues and new all time highs will follow. But in order for that to happen, Nvidia has to confirm the all time high breakout now.
📝Levels to watch:
$150
🙏🏻#LONGTERMVISION
SwingTraderPhil
NVDA01 trade ideas

Bullish Continuation Based on this strong resistance here around 183.82, there's some strong upside if price breaks through. If it rejects there's light support around 179 and strong support around 178.

NVDA Approaching Premium Supply – Breakout or Double Top?📊 Market Breakdown
NVDA is trading at $182.70 and pressing into the Premium/Supply Zone ($184.36). The stock is riding a strong ascending wedge pattern, but with RSI at 69.70 (near overbought) and price stretched from the equilibrium, we’re at a critical decision point.
Trend: Strong uptrend from the $123–$135 base, breaking above previous highs.
Key Structure: Price launched from the equilibrium zone (~$135), skipping retests and heading straight toward supply.
Volume: Recent push has healthy volume, but we’re starting to see signs of slowing.
Indicators:
MACD: Bullish but momentum is flattening.
RSI: 69.70 – close to overbought, increasing risk of pullback.
🛒 CALLS (Bullish Scenario)
Buy Zones:
🎯 Aggressive Entry: Bounce from $175–$178 support within wedge
✅ Confirmation Entry: Break & daily close above $185 with volume
Take Profits:
1️⃣ $195 – Psychological round number
2️⃣ $210 – Wedge breakout target
3️⃣ $225 – Extension target if momentum remains strong
Stop-Loss: $172
Why This Works: Breakout above $185 clears supply and could spark a momentum run to $195+ in 2–3 weeks.
🛑 PUTS (Bearish Scenario)
Sell Zones:
🚨 Aggressive Entry: Rejection at $184–$185 supply zone
📉 Breakdown Entry: Close below $175 support
Take Profits:
1️⃣ $160 – Mid-wedge support
2️⃣ $135 – Equilibrium zone
3️⃣ $123 – Major prior demand
Stop-Loss: $188
Why This Works: Rejection at supply with overbought RSI could send NVDA back toward $160–$135 in 1–2 weeks.
🔍 Technical Highlights
Pattern: Ascending wedge nearing apex; breakout or breakdown imminent.
Supply Zone Test: $185 is a key resistance level; watch reaction closely.
Macro Watch: NVDA is highly sensitive to AI sector momentum and NASDAQ performance.
⏳ Option Expiration Strategy:
1 Week: Rejection play off $185
2–3 Weeks: Breakout targeting $195–$210

Nvidia - This is clearly not the end!📐Nvidia ( NASDAQ:NVDA ) will simply rally more:
🔎Analysis summary:
Yes, over the past couple of months, Nvidia has been rallying another +100%. But looking at the higher timeframe, this is still not the end of the unbelievable bullrun. Following the rising channel pattern, Nvidia can rally another +20% before we might see a potential retracement.
📝Levels to watch:
$250
SwingTraderPhil
SwingTrading.Simplified. | Investing.Simplified. | #LONGTERMVISION

NVDA: Bullish Channels and Momentum CheckWe're seeing a compelling case for continued upward momentum in NVDA, but it's crucial to understand the different layers of the trend and key resistance levels.
Macro Trend: The Expanding Bullish Channel
On the weekly timeframe, a larger expanding bullish channel has been forming. The price is currently near the top of this larger channel, which could act as a significant resistance level. This gives us a long-term context for the stock's current price action.
Micro Trend: The 'Small' Bullish Channel
Zooming in, NVDA is currently moving within a smaller, short-term bullish channel. The linear regression tool that I've created confirms this upward momentum. This smaller channel shows the real-time path buyers are following. It's a great way to see the current trend in detail and identify short-term support and resistance.
Momentum Check: The Weekly RSI
While the price action looks strong, a look at the weekly RSI (Relative Strength Index) suggests a note of caution. The RSI has been in a strong upward trend, but when comparing the current state to previous weekly RSI oversold positions, it appears the momentum could be "tapped a little harder." This might imply that the stock could experience a short-term pullback to cool off before a potential breakout, especially since we're currently close to the top of the large channel. Though I’m not necessarily seeing any pullback indicated yet, being we are currently sitting safe above the bottom of the current smaller bullish channel.
Conclusion: Key Levels to Watch
My analysis suggests that NVDA has strong upward momentum within two distinct bullish channels. I've marked various price targets that align with my charting and are designated by professionals as key levels to watch.

Proprietary SupportIn this slowly but continuously updating idea I will be posting an interesting way to analyze charts. It is something old but also new, like duality.
We all know that the stock market continuously grows.
But it doesn't always grow.
For markets lie between worlds.
The reasonable and the unreasonable.
The free choice and the illusion of free choice.
Let me explain...
In micro scale, we seem to believe that the markets follow the "support / resistance" rule.
An (over)simplification necessary for us to comprehend the infinities of the quantum world.
There are lots of stories told in the picture above...
- Prices are chaotic and completely incomprehensible.
- We have to smooth-out to get a clearer picture.
- Is Support / Resistance real or a result of crowd psychology?
- At what point horizontal action "ceases" to exist and "trend" takes over?
Either we call it a "power law" or a Lin-log regression, charts in macro scale seem to trend.
So prices sometimes move with one "law" (support) and sometimes with another (trend).
Do we remember / know what is the foundation of price movement?
A century ago, Wyckoff came up with his theory of accumulation and distribution.
We can safely say that his research was not a result of crowd psychology. He backtested countless price charts, in a period (1920s) when trading was purely psychological, with traders having little experience to modern ideas of "trend", "support" etc.
Just like the new modern technology design principles, ahem aapl, technological information lies inside bubbles. Transparent but distorted. Clear but fuzzy. Duality once again.
Modern trading is a self sustaining loop. The "freedom" of our actions is trapped inside a bubble. Most of us "trade" with similar strategies, and end up in the mass pool of barely-profitable-investors. Unconventional strategists like Hedge Funds must have "alien" technology to overcome such psychological traps.
Back to the main chart:
It is one attempt to bring a new dimension to chart analysis. To merge these two worlds of "support" and "trend". I cannot possibly reach the expertise of massive corporations, but I can bodge something out, and I did.
Price charts can be analyzed with unconventional / proprietary methods to conclude into the chart above. It is a little rough but bear with me. I had to perform complex calculations which I couldn't compile into a Pine Indicator. There is a reason that the top lines are not exactly straight. Their calculations depend on a blend between micro and macro movements.
A couple of interesting charts to conclude the first update of this idea:
BTC Daily
BTC Weekly
A Perfect Fractal.
I hate bubbles. Mental ones, Soapy ones, Stock ones and UI ones.
- An angry Father Grigori.

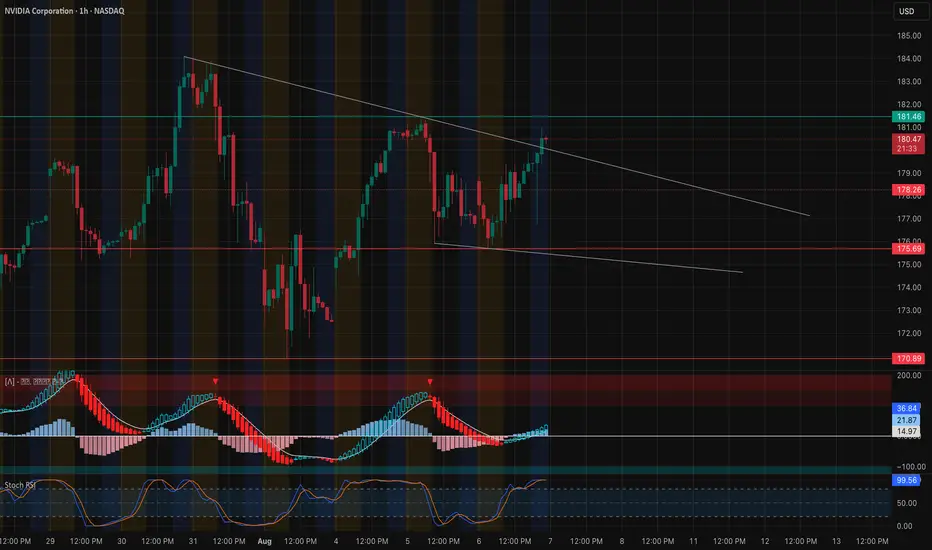
NVIDIA at the Crossroads: Will This Breakout Hold or Fake? Aug 7🧠 Technical Analysis – 1H + 15M Chart
NVDA is testing the upper bound of a symmetrical triangle on the 1-hour chart — a critical spot that could either break for continuation or reject back into the wedge.
* Trendline resistance from previous highs is pressing NVDA around 180.80–181.50.
* Stochastic RSI is overheated (>99), suggesting a potential pullback or fakeout before true breakout strength.
* MACD is crossing bullish with increasing histogram momentum — short-term buyers are stepping in.
On the 15-minute chart, we see:
* Tight coil forming near 181.00.
* Minor resistance at 181.46 from previous rejection.
* A bullish breakout above 182.00 on volume would confirm a short-term rally.
⚠️ Keep an eye for a potential fakeout above trendline and reversal back below 179.70 — a CHoCH could trap late bulls.
💥 GEX + Options Sentiment (Based on 1H Chart)
* GEX Map shows massive resistance forming around 182.5–185, with:
* 57.12% Call Wall at 182.5
* 51.68% Call Wall at 185
* Gamma is heavily concentrated just above current price — strong dealer hedging could cap upside moves if flow doesn't increase.
* Support Zones:
* 175 → Put support and HVL level
* 172.5 → Cluster of downside GEX risk (-7.23%)
* IVR is at 19.3 (low), with Call flow only at 3.4% — suggesting institutions are not aggressively chasing upside here.
🎯 Trade Scenarios
Bullish Breakout Setup
* ✅ Entry: Above 182.00 breakout
* 🎯 Target: 184.20 → 185.50
* 🛑 Stop: Below 179.50 or re-entry inside triangle
Bearish Rejection Setup
* 🔻 Entry: Rejection from 181.50–182.00 zone
* 🎯 Target: 178.20 → 175
* 🛑 Stop: Above 182.30
My Thoughts:
NVDA is at a decision point — either break out and squeeze through GEX walls or get trapped and fade to lower support zones. Volume and reaction at 182 will be key. This is a high-risk area for chasers — ideal zone for scalpers and short-term breakout traders with tight stops.
Disclaimer: This analysis is for educational purposes only and does not constitute financial advice. Always do your own research and manage your risk accordingly.
NVDA NVIDIA Price Target by Year-EndNVIDIA Corporation (NVDA) remains a dominant force in the AI and semiconductor markets, with its forward price-to-earnings (P/E) ratio currently at 19.37—a reasonable valuation considering its growth trajectory and market position.
NVIDIA’s leadership in the AI sector, particularly through its cutting-edge GPUs, has driven strong demand from data centers, cloud providers, and AI developers. The company’s recent product launches, including the Hopper and Blackwell architectures, have further solidified its competitive edge.
Despite recent market volatility, NVIDIA's consistent revenue growth and expanding profit margins support the bullish case. The current P/E of 19.37 reflects a balanced risk-reward profile, suggesting that the stock is not overvalued despite its impressive performance.
A price target of $145 by year-end reflects approximately 15% upside from current levels, driven by sustained AI demand and growing market penetration. Investors should watch for quarterly earnings reports and updates on AI chip demand, as these will likely act as key catalysts for upward momentum.

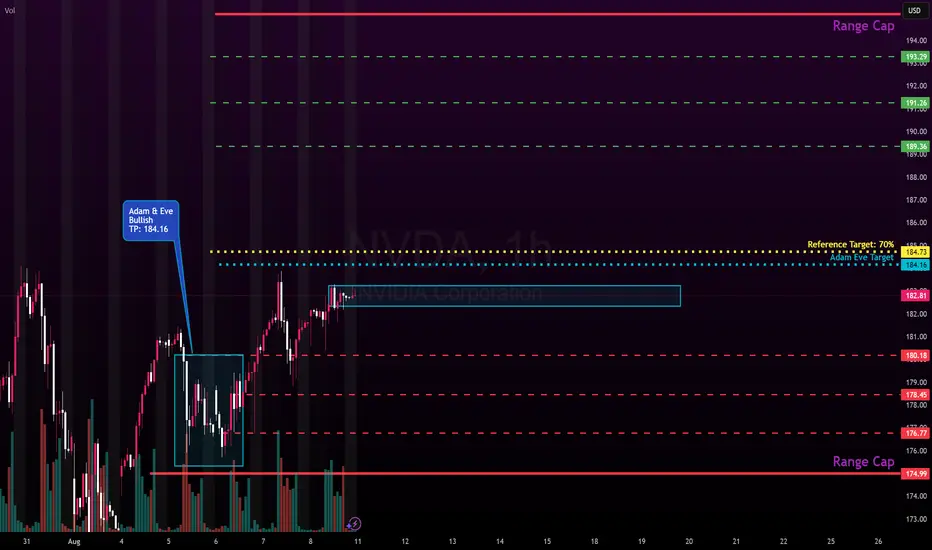
NVDA: Week of Aug 11Expectations for NVDA is.. shocker.. continuation up .
Here is the summary of what to know for next week on NVDA:
Forecasts
Weekly 30 minute: bullish, trending up after initial consolidation into beginning of week.
Weekly hourly: bullish trending up.
Daily for Monday: Rally off open but fades and consolidates for the day. Consistent between 1-minute and 5-minute forecasts.
Fibs
183 is 0% retracement, expect initial resistance here.
Chart Patterns
Bullish adam eve on the hourly formed, with TP listed in chart.
Math Projections
In addition to forecast, the following are modelled projections for next week:
Projected high: 191.65
Projected low: 179.73
Reference target (modelled target) 184 with a 70% hit rate, so watch that. Open above it, its a bearish target. Open below it, its a bullish target.
Options:
Flow alert on a really random ITM 2.0 contract of 614.7K premium with 2026-01-06 expiry.
Put/call skew PUTs 19.6% / CALLs 80.4%
Also 1.59 Mil in premiums on the 120 strike
Implied high: 191.50
Implied low: 173.89
CPI and PPI into Tuesday and Wednesday so be watchful of that.
Just sharing observations and projections, not advice.
Safe trades!
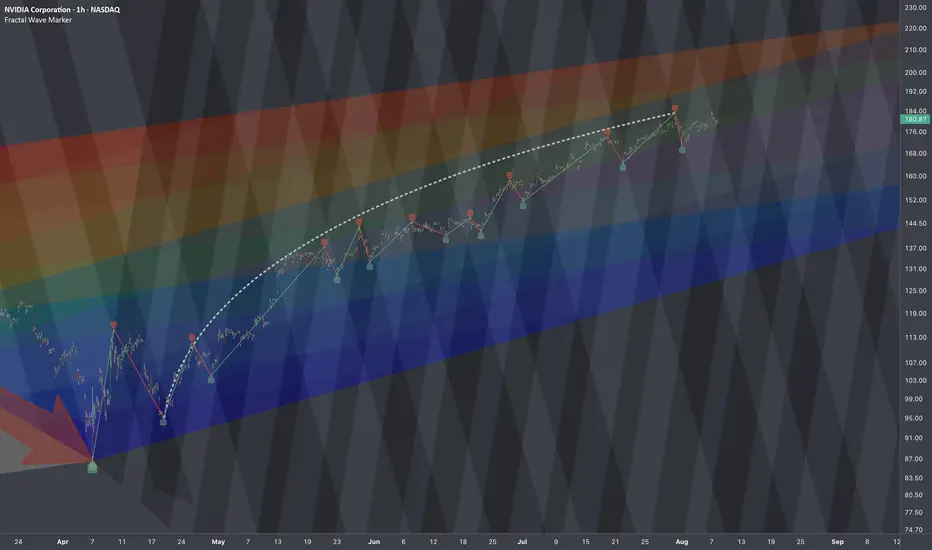
$NVDA: Tracking Formations🏛️ Research Notes
Frames of Reference
Interconnection of 3rd degree points fractal hierarchy
Multi-scale Interconnection
Merging into probabilistic layout
Market movement reflects proportional relationships inherent to its own scale. Fibonacci ratios, appear not by accident but as structural constants within this probabilistic environment. Price and time intervals often align with these ratios because markets are recursive systems where past structures inform the formation of new ones through scaled transformation. In this framework, the golden ratio serves as more than a tool for retracements or extensions, as encodes the geometry of market behavior itself via frames of reference. Whether in the spacing of pivots, the rhythm of cycles, or the layering of trends, its presence points to a self-organizing principle at work.
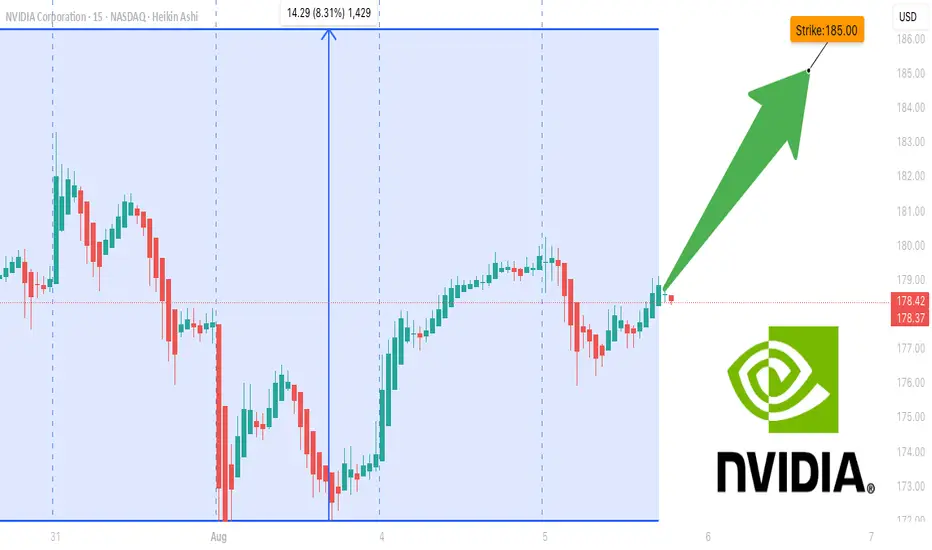
NVDA Don't Miss Out !!!!
**NVDA \$185C Weekly Momentum Surge ⚡ All Models Aligned – 75% Confidence Setup 🔥**
---
### 📊 **Post Body (Optimized for TradingView):**
**NVDA Weekly Call Play — Aug 8 Expiry (3 DTE) 🔥**
📈 **Momentum Snapshot:**
* **Weekly RSI:** 🔼 Above 50 and climbing
* **Daily RSI:** 🔻 Falling — short-term caution
* **Volume:** 1.2x previous week (🟢 Institutional flow)
* **Volatility (VIX):** <22 — favorable setup
* **Gamma Risk:** 🟠 Moderate
---
🧠 **Model Scorecard Summary:**
* **Grok / xAI:** 4/5 Bullish 🟢
* **Gemini (Google):** 3/5 Bullish with 80% confidence 🟢
* **Claude (Anthropic):** 5/5 Bullish 💯
* **LLaMA (Meta):** 4/5 Bullish 💪
* **DeepSeek:** 5/5 Bullish 🚀
✅ **Consensus:** Strong Bullish 🔥
---
### 💡 **Trade Setup:**
* 🎯 **Strategy:** Long CALL
* 🟢 **Strike:** \$185
* 📅 **Expiry:** Aug 8, 2025
* 💵 **Entry Price:** \$0.96
* 📈 **Target Exit:** \$1.90 (100% gain)
* 🛑 **Stop Loss:** \$0.48 (50% risk cap)
* 📏 **Size:** 1 contract
* ⏰ **Timing:** Market Open
* 📊 **Confidence Level:** 75%
---
⚠️ **Key Risks to Watch:**
* Time decay – Only 3 DTE ⏳
* Daily RSI divergence 😬
* Gamma risk & market volatility (track \ TVC:VIX )
---
### 🧾 **Auto-Logger JSON (for tracking):**
```json
{
"instrument": "NVDA",
"direction": "call",
"strike": 185.00,
"expiry": "2025-08-08",
"confidence": 0.75,
"profit_target": 1.90,
"stop_loss": 0.48,
"size": 1,
"entry_price": 0.96,
"entry_timing": "open",
"signal_publish_time": "2025-08-05 09:43:22 UTC-04:00"
}
```
---
### 🏷️ **Suggested Hashtags (TradingView Style):**
`#NVDA #OptionsTrading #WeeklyOptions #CallOptions #MomentumStocks #AIStocks #TechLeaders #TradingSetup #RSISignal #GammaSqueeze #NVIDIA #OptionAlert #HighConviction #TradeIdeas #TechBreakout`
Nvidia 184 CallsNvidia 184 Calls
🔍 Pattern Analysis
• You’ve identified an ascending triangle pattern:
• Rising trendline support (black line).
• Flat resistance near the $183.78 level (green box).
• This is a bullish continuation pattern, especially in an uptrend like NVDA has been in.
Key Levels
• Current Price: ~$182.83
• Resistance / Breakout Zone: ~$183.78 (clearly marked)
• Support Levels:
• Short-term: $182.16, $181.49
• Risk Level (Stop): ~$178.90
• Stronger Support: $175.75, $174.57
• Target (Take Profit): ~$190.03 (marked in green)
Trade Setup (Buy Breakout)
• Entry: Around the breakout of $183.78
• Stop Loss: ~$178.90 (below recent lows)
• Take Profit: ~$190.03
• Risk/Reward Ratio: Roughly 1:2, which is solid
Volume Observation
• Volume has been decreasing during consolidation, which is typical before a breakout.
• Watch for a volume spike to confirm the breakout above $183.78.
Risks & Notes
• Price is currently near resistance; wait for a confirmed breakout (candle close above $183.78).
• If it rejects this level again, a break below the ascending trendline could flip the setup bearish.
• If support at $181.49 or $178.90 breaks, NVDA could pull back toward $175 or even $171.
Final Thought
This is a bullish setup, but confirmation is key. Either:
• Enter on breakout with volume confirmation.
• Or wait for a retest of $183.78 as support after the breakout.

$NVDA - $280-300 YEAR END TARGET Trend is your friend, just keep it simple. Lots of runway ahead accompanied with improved gross margins of mid 70% during back half of the year on already high margins. Technical trend channel has a price objective between $280 to almost $300.

NVDA Don’t Miss Out## ⚡ NVDA Swing Setup (2025-08-08) ⚡
**Bias:** 📈 **Moderate Bullish** — RSI hot (67), trend up, low VIX, but volume still meh.
**🎯 Trade Plan**
* **Ticker:** \ NASDAQ:NVDA
* **Type:** CALL (LONG)
* **Strike:** \$185.00
* **Entry:** \$3.15 (near open)
* **Profit Target:** \$4.65 (+48%)
* **Stop Loss:** \$2.13 (-30%)
* **Expiry:** 2025-08-22 (14DTE)
* **Size:** 1 contract
* **Confidence:** 75%
**📊 Key Notes**
* RSI strong = momentum on your side ✅
* VIX favorable for calls ✅
* Weak volume & neutral flow = confirm before adding size ⚠️
* Watch breakout above **\$183.88** for momentum kick
**💡 Play Idea:**
Ride momentum to \$195+, take 50% profits at \$4.65, trail stops to lock gains.

$NVDA filled the gap. NASDAQ:NVDA filled the gap on the downside. A lot of bearish flow came in yesterday. But today the flow was bullish early.
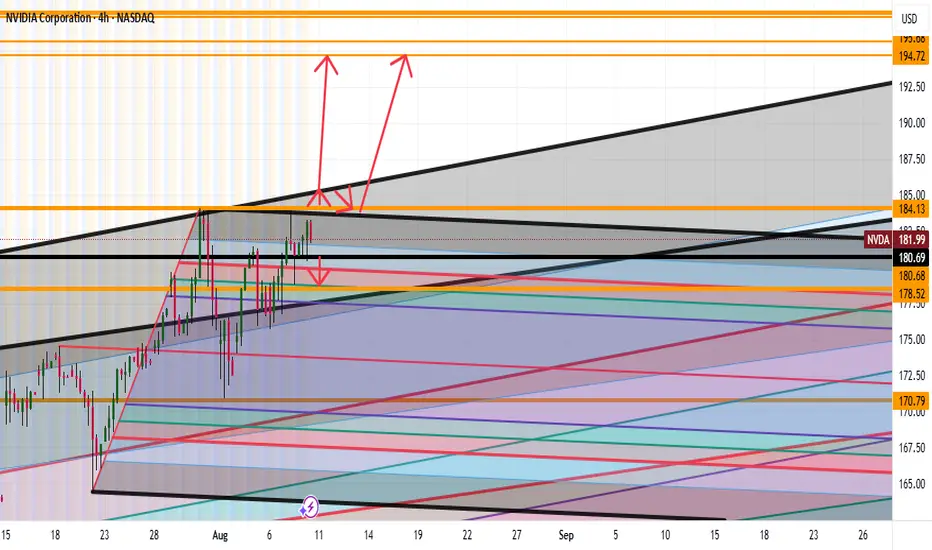
NVDA Going to 194 Full AnalysisGood afternoon Traders
So looking at NVDA we have a strong monthly bullish trend
Micro though we see the following:
Bearish: If we break the lows of 180 expect to see 178 getting hit
Bullish: Break 184 highs then expect to see a punch up to 185 then small correction then a big up to 190's or we miss the correction and blow right through to the 190's
Happy Trading Folks
Trade Smarter Live Better
Kris
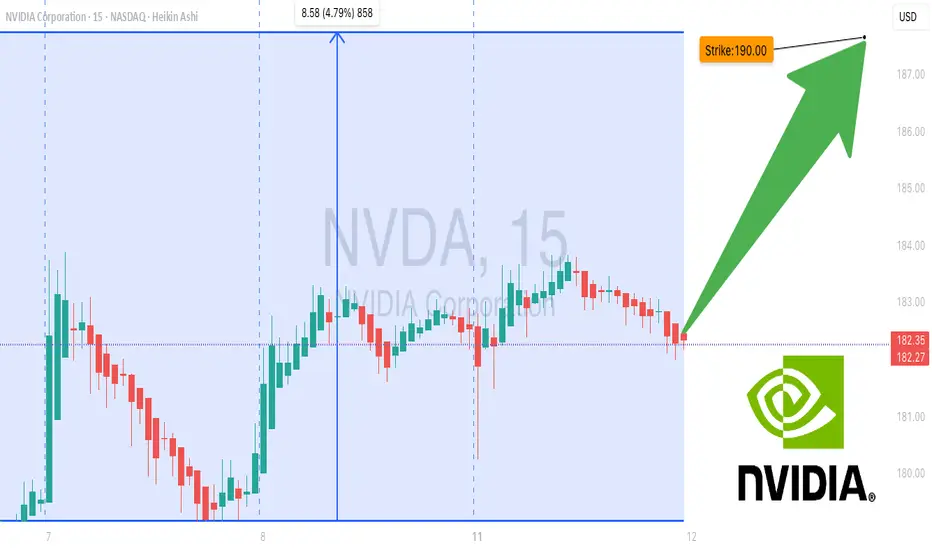
NVDA don’t Miss Out--$190 Call Target, Momentum on Fire## 🚀 NVDA Weekly Options Breakdown (Aug 11, 2025) 🚀
### 🔥 Market Sentiment: Bullish Bias Across Models
* **Grok/xAI**: Strong Bullish — rising RSI & bullish flow, but *watch weak volume*.
* **Claude/Anthropic**: Moderate Bullish but *no trade* due to policy risks & volume doubts.
* **Gemini/Google**: Moderate Bullish, recommends **\$192.5 calls** with stop loss — volume risk noted.
* **Llama/Meta**: Bullish — buy **\$190 calls**, manage volatility & premium decay.
### ✅ Consensus Trade Setup:
**Buy \$190 Calls** expiring Aug 15 @ \$0.70 premium
* 🎯 Profit Target: \$0.91
* 🛑 Stop Loss: \$0.35
* 📊 Confidence: 70%
* ⏰ Entry: Market Open Next Trading Day
### ⚠️ Key Risks:
* Policy/news impact on semiconductor sector
* Moderate gamma risk & possible volatility spikes near expiry
---
### 🔍 Model Insights Breakdown
| Model | Sentiment | Trade Idea | Confidence |
| ---------------- | ---------------- | ------------------------------ | ---------- |
| Grok/xAI | Strong Bullish | Buy \$190 Calls | 70% |
| Claude/Anthropic | Moderate Bullish | No trade (high news risk) | 45% |
| Gemini/Google | Moderate Bullish | Buy \$192.5 Calls w/ stop loss | 65% |
| Llama/Meta | Bullish | Buy \$190 Calls w/ risk mgmt | 70% |
---
### 💡 Why This Matters
* RSI and options flow point strongly bullish — calls dominate puts 1.2+ ratio
* Volume confirmation weak, so *manage risk tightly*
* Position best for aggressive traders ready to manage fast moves
---
📈 **NVDA Weekly Options Trade Summary**
```json
{
"instrument": "NVDA",
"direction": "call",
"strike": 190.0,
"expiry": "2025-08-15",
"confidence": 0.70,
"profit_target": 0.91,
"stop_loss": 0.35,
"size": 1,
"entry_price": 0.70,
"entry_timing": "open",
"signal_publish_time": "2025-08-11 10:33:48 UTC-04:00"
}
```
Nvidia 184.00 Calls aboveNvidia 184 Calls
🔍 Pattern Analysis
• You’ve identified an ascending triangle pattern:
• Rising trendline support (black line).
• Flat resistance near the $183.78 level (green box).
• This is a bullish continuation pattern, especially in an uptrend like NVDA has been in.
⸻
📊 Key Levels
• Current Price: ~$182.83
• Resistance / Breakout Zone: ~$183.78 (clearly marked)
• Support Levels:
• Short-term: $182.16, $181.49
• Risk Level (Stop): ~$178.90
• Stronger Support: $175.75, $174.57
• Target (Take Profit): ~$190.03 (marked in green)
⸻
📈 Trade Setup (Buy Breakout)
• Entry: Around the breakout of $183.78
• Stop Loss: ~$178.90 (below recent lows)
• Take Profit: ~$190.03
• Risk/Reward Ratio: Roughly 1:2, which is solid
⸻
📌 Volume Observation
• Volume has been decreasing during consolidation, which is typical before a breakout.
• Watch for a volume spike to confirm the breakout above $183.78.
⸻
⚠️ Risks & Notes
• Price is currently near resistance; wait for a confirmed breakout (candle close above $183.78).
• If it rejects this level again, a break below the ascending trendline could flip the setup bearish.
• If support at $181.49 or $178.90 breaks, NVDA could pull back toward $175 or even $171.
⸻
🧠 Final Thought
This is a bullish setup, but confirmation is key. Either:
• Enter on breakout with volume confirmation.
• Or wait for a retest of $183.78 as support after the breakout.
Let me know if you want a bearish scenario or a shorter time frame breakdown.

(updated) NVDA Bounces Off the 100 EMA AgainPrice keeps respecting the 100 EMA as a pickup zone — just like every other pullback in this trend.
📌 EMAs still stacked in bullish configuration
📌 NVDA holding inside rising channel
📌 Each tag of the teal line = another entry opportunity
⏱️ Timeframe: 1H
#nvda #stocks #technicalanalysis #ema #trendtrading #chartupdate #tradingview

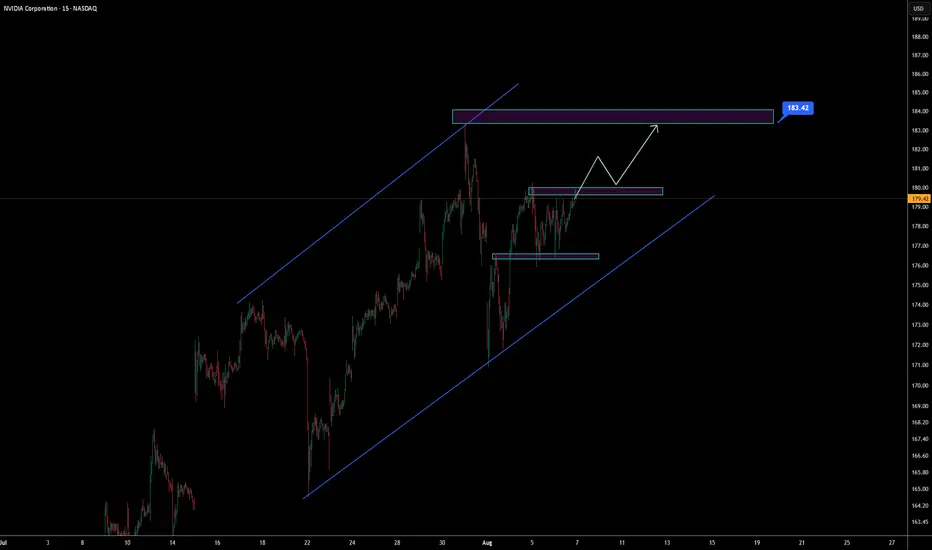
NVIDIA Approaching Breakout – Targeting 183.42 Within AscendingNVIDIA is moving within a well-defined ascending channel.
The price is currently consolidating near a local resistance area, showing signs of bullish continuation.
A breakout above this zone could confirm momentum toward the upper boundary of the channel, with a projected target around 183.42.
Watching for bullish structure and volume confirmation.
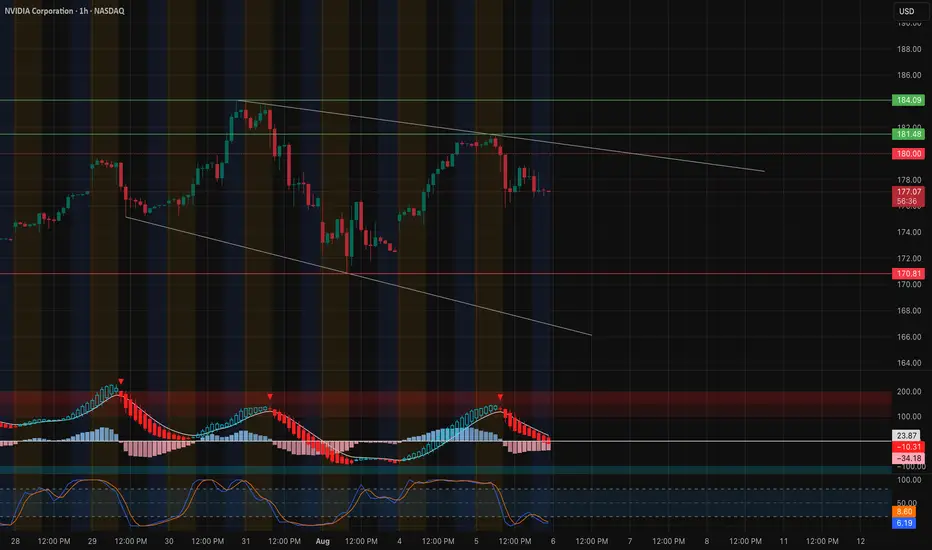
NVDA at a Make-or-Break Level. TA for Aug. 6🚀 NVDA at a Make-or-Break Level — Key GEX & Price Action Signals
Technical Overview (1H Chart)
NVDA is currently trading around 177.15, sitting just under the 180 psychological and technical resistance. Price action remains inside a descending channel, with sellers defending the 180 level while buyers have been active near 175.
The recent bounce from 170.80 aligns with the bottom channel support, but the lack of strong follow-through shows hesitation ahead of heavy resistance.
Gamma Exposure (GEX) Insights
* Major Call Walls:
* 180 → Highest positive GEX & Gamma Wall resistance.
* 184.09–185 → 2nd Call Wall cluster, significant dealer hedging pressure if broken.
* Put Support Zones:
* 175 → Strong GEX-based put support; losing this could accelerate downside.
* 170.80 → Major pivot & prior low, last strong GEX defense.
* Dealers are positioned in a way that staying below 180 keeps upside contained, while a clear breakout above 180 could trigger dealer covering and a squeeze toward 184–185.
Momentum & Oscillators
* MACD → Bearish momentum cooling off but still in the red, suggesting consolidation.
* Stoch RSI → Oversold zone, signaling potential short-term bounce attempt.
Trade Scenarios
* Bullish Case: Break & hold above 180 opens the door for 184–185 retest. Option traders could target near-term calls above 180 with tight stops.
* Bearish Case: Rejection at 180 and drop back under 175 could lead to 170.80 retest. Ideal for puts targeting 175 → 171 zone.
Options Trading Thoughts (Based on GEX)
* Preferred Bullish Setup: Wait for confirmed breakout over 180 → Calls targeting 184 strike, short expiry for momentum.
* Preferred Bearish Setup: Puts if rejection at 180 holds & price slips below 175, targeting 172–171 zone.
Disclaimer: This analysis is for educational purposes only and not financial advice. Always manage your risk.
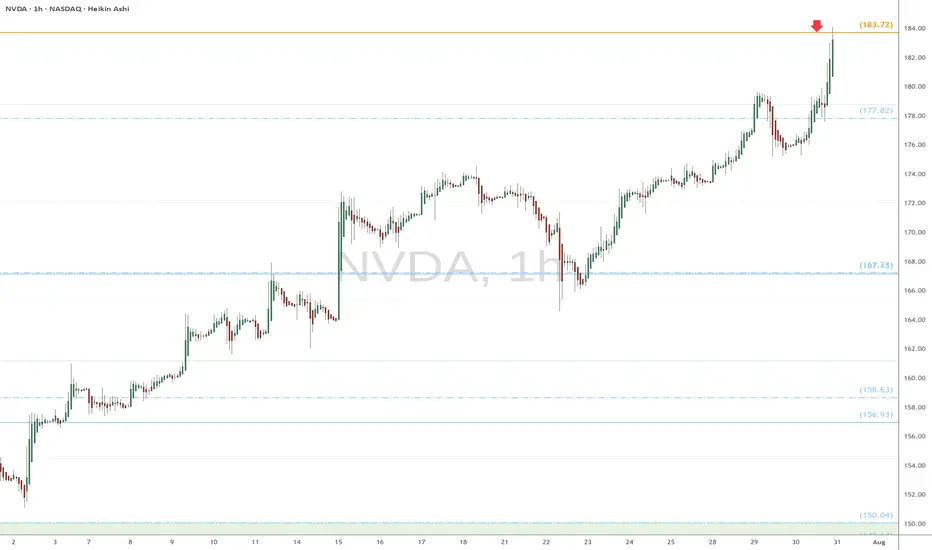
NVDA heads up at $183.72: Golden Genesis fib to mark a TOP?Chips have been flying high since the April lows.
NVDA has just hit a Golden Genesis fib at $183.72
This is a "very high gravity" fib so expect a reaction.
It is PROBABLE that we "orbit" this fib a few times.
It is POSSIBLE that we reject to form a major top.
It is PLAUSIBLE that we Break-n -Retest to continue.\
.
See "Related Publications" for previous EXACT plots ------>>>>>>>>
Such as this post at the last Golden Genesis:
Hit the BOOST and FOLLOW for more such PRECISE and TIMELY charts
============================================================
.
NVIDIANVIDIA Corporation is a leading American technology company known for designing and manufacturing graphics processing units (GPUs), system-on-a-chip units (SoCs), and AI computing platforms. Founded in 1993, the company originally focused on gaming graphics but has since evolved into a global powerhouse in artificial intelligence, data centers, autonomous vehicles, and high-performance computing. NVIDIA’s GPUs are widely used not only in gaming and visual computing but also in scientific research, AI model training, machine learning, and cloud infrastructure.
In recent years, NVIDIA has been at the forefront of the global AI boom. Its data center business, powered by its high-end GPU architecture (like the H100 and newer generations), has become a critical backbone for tech companies, cloud providers, and governments seeking to build large-scale AI systems. The company also made major strategic moves through acquisitions and software integration, further solidifying its dominance in the AI hardware space. NVIDIA’s strong financial performance and technological leadership led to rapid growth in its market capitalization, briefly making it one of the most valuable companies in the world.
As of August 2025, NVIDIA’s stock is trading at $173.60 per share, following a stock split that adjusted its price while increasing liquidity. Despite broader market volatility, NVIDIA remains a key player driving the AI revolution and is closely watched by investors and analysts. Its valuation continues to be shaped by demand for AI chips, innovation in GPU architecture, and its ability to maintain technological leadership amid growing global competition. NVIDIA stands at the intersection of multiple megatrends, making it a critical stock in both the technology and semiconductor sectors.
