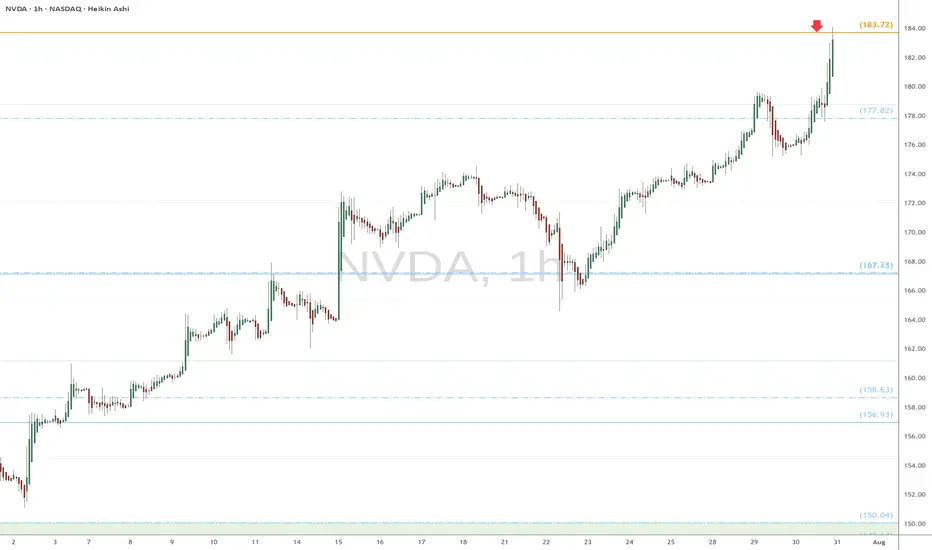
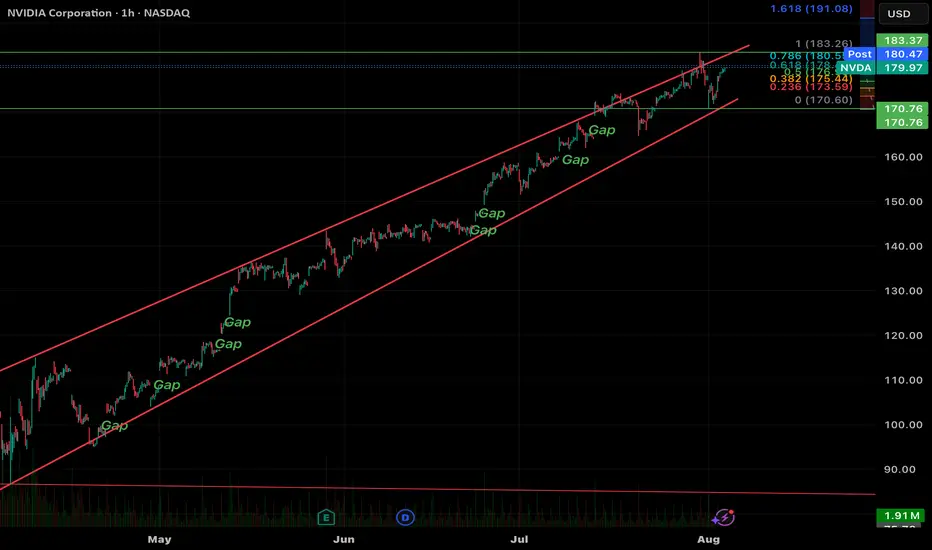
NVDA heads up at $183.72: Golden Genesis fib to mark a TOP?Chips have been flying high since the April lows.
NVDA has just hit a Golden Genesis fib at $183.72
This is a "very high gravity" fib so expect a reaction.
It is PROBABLE that we "orbit" this fib a few times.
It is POSSIBLE that we reject to form a major top.
It is PLAUSIBLE that we Break-n -Retest to continue.\
.
See "Related Publications" for previous EXACT plots ------>>>>>>>>
Such as this post at the last Golden Genesis:
Hit the BOOST and FOLLOW for more such PRECISE and TIMELY charts
============================================================
.
NVDA01 trade ideas
NVDA: 180.77Bullish Entry: 184.00 / 186.00 Bullish Stop 180.50 Bullish Target 188.00
Bearish Entry: 180.00 / 176.00 Bearish Stop 182.00 Bearish Target 174.00

NVDA Don't Miss Out !!!!
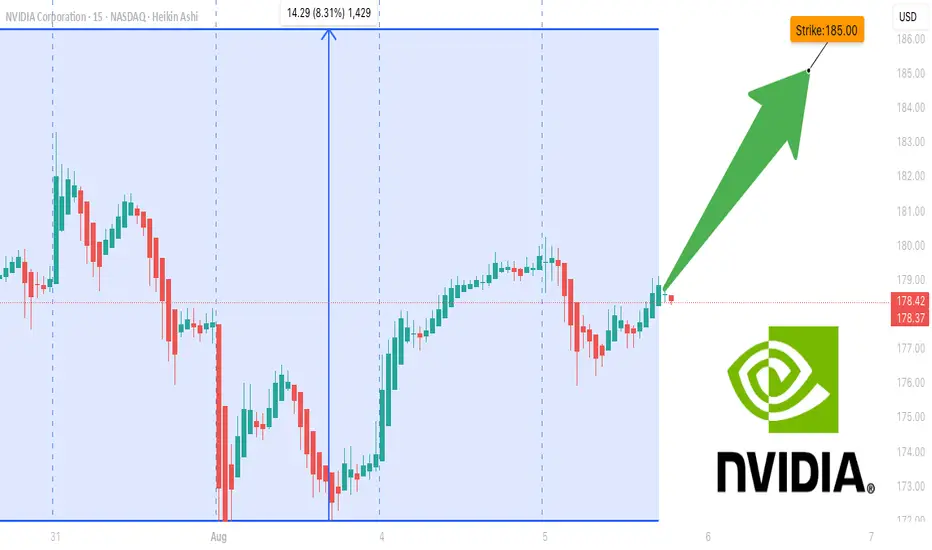
**NVDA \$185C Weekly Momentum Surge ⚡ All Models Aligned – 75% Confidence Setup 🔥**
---
### 📊 **Post Body (Optimized for TradingView):**
**NVDA Weekly Call Play — Aug 8 Expiry (3 DTE) 🔥**
📈 **Momentum Snapshot:**
* **Weekly RSI:** 🔼 Above 50 and climbing
* **Daily RSI:** 🔻 Falling — short-term caution
* **Volume:** 1.2x previous week (🟢 Institutional flow)
* **Volatility (VIX):** <22 — favorable setup
* **Gamma Risk:** 🟠 Moderate
---
🧠 **Model Scorecard Summary:**
* **Grok / xAI:** 4/5 Bullish 🟢
* **Gemini (Google):** 3/5 Bullish with 80% confidence 🟢
* **Claude (Anthropic):** 5/5 Bullish 💯
* **LLaMA (Meta):** 4/5 Bullish 💪
* **DeepSeek:** 5/5 Bullish 🚀
✅ **Consensus:** Strong Bullish 🔥
---
### 💡 **Trade Setup:**
* 🎯 **Strategy:** Long CALL
* 🟢 **Strike:** \$185
* 📅 **Expiry:** Aug 8, 2025
* 💵 **Entry Price:** \$0.96
* 📈 **Target Exit:** \$1.90 (100% gain)
* 🛑 **Stop Loss:** \$0.48 (50% risk cap)
* 📏 **Size:** 1 contract
* ⏰ **Timing:** Market Open
* 📊 **Confidence Level:** 75%
---
⚠️ **Key Risks to Watch:**
* Time decay – Only 3 DTE ⏳
* Daily RSI divergence 😬
* Gamma risk & market volatility (track \ TVC:VIX )
---
### 🧾 **Auto-Logger JSON (for tracking):**
```json
{
"instrument": "NVDA",
"direction": "call",
"strike": 185.00,
"expiry": "2025-08-08",
"confidence": 0.75,
"profit_target": 1.90,
"stop_loss": 0.48,
"size": 1,
"entry_price": 0.96,
"entry_timing": "open",
"signal_publish_time": "2025-08-05 09:43:22 UTC-04:00"
}
```
---
### 🏷️ **Suggested Hashtags (TradingView Style):**
`#NVDA #OptionsTrading #WeeklyOptions #CallOptions #MomentumStocks #AIStocks #TechLeaders #TradingSetup #RSISignal #GammaSqueeze #NVIDIA #OptionAlert #HighConviction #TradeIdeas #TechBreakout`
Nothing left of nvidia when quantum compute takes over graphicsNothing left of nvidia when quantum compute takes over graphics. The price would go from 200 to 20 in no time (several years)
(updated) NVDA Bounces Off the 100 EMA AgainPrice keeps respecting the 100 EMA as a pickup zone — just like every other pullback in this trend.
📌 EMAs still stacked in bullish configuration
📌 NVDA holding inside rising channel
📌 Each tag of the teal line = another entry opportunity
⏱️ Timeframe: 1H
#nvda #stocks #technicalanalysis #ema #trendtrading #chartupdate #tradingview

Emotional Reactivity: The Silent Killer of Trading PerformanceEven with the best strategy, traders often fall short — not because the system fails, but because they do. One of the most common culprits? Emotional reactivity.
Fear and greed are the twin saboteurs.
Fear leads to hesitation, premature exits, or failure to take action.
Greed tempts us to oversize, chase trades, or hold too long.
These emotional spikes don’t just “feel bad” — they disrupt the brain’s decision-making systems. Under pressure, the amygdala takes over, bypassing the prefrontal cortex (where rational thinking happens)—this results in reactive behaviour: impulse entries, revenge trades, panic exits.
🔧 How to Defeat Emotional Reactivity
Here are proven strategies that work — not just in theory, but in the trenches of real-world trading.
✅ 1. Use Pre-Defined Rules & Checklists
The more rules you build into your system, the less room there is for emotion to interfere.
Think: “If X and Y are true, then I enter — no debate.”
🎯 2. Risk in Terms of ‘R’
Instead of thinking “I’m risking $5,000,” say “I’m risking 1R.”
This reframing normalises risk, reduces attachment, and keeps you focused on process over outcome.
📓 3. Track Emotional States in Your Journal
Don’t just log trades. Record your mental state before and after.
Over time, patterns emerge: when you’re most reactive, most hesitant, most aggressive.
🧘 4. Control Your Environment & Physiology
Fatigue, caffeine overload, or noise can heighten emotional spikes.
A calm workspace and healthy habits reduce the likelihood of hijacked decision-making.
🌬️ 5. Use Breathing to Regulate State
Even 60 seconds of box breathing can short-circuit fear.
Try this: inhale 4 sec → hold 4 sec → exhale 4 sec → hold 4 sec.
🕵️♂️ 6. Trade Fewer, Higher-Conviction Setups
Most overtrading is emotional.
By filtering out B-grade trades, you reduce stress and decision fatigue.
Final Word
You can’t eliminate emotion — but you can contain it.
The goal is to become emotionally aware and systematically anchored.
Master this, and you stop trading your feelings — and start trading your edge.
👍 If this resonated, drop a like or comment below.
🔁 Repost to help other traders cut through the noise.
📌 Follow for more mindset and execution tips grounded in real-world trading.

NVIDIANVIDIA Corporation is a leading American technology company known for designing and manufacturing graphics processing units (GPUs), system-on-a-chip units (SoCs), and AI computing platforms. Founded in 1993, the company originally focused on gaming graphics but has since evolved into a global powerhouse in artificial intelligence, data centers, autonomous vehicles, and high-performance computing. NVIDIA’s GPUs are widely used not only in gaming and visual computing but also in scientific research, AI model training, machine learning, and cloud infrastructure.
In recent years, NVIDIA has been at the forefront of the global AI boom. Its data center business, powered by its high-end GPU architecture (like the H100 and newer generations), has become a critical backbone for tech companies, cloud providers, and governments seeking to build large-scale AI systems. The company also made major strategic moves through acquisitions and software integration, further solidifying its dominance in the AI hardware space. NVIDIA’s strong financial performance and technological leadership led to rapid growth in its market capitalization, briefly making it one of the most valuable companies in the world.
As of August 2025, NVIDIA’s stock is trading at $173.60 per share, following a stock split that adjusted its price while increasing liquidity. Despite broader market volatility, NVIDIA remains a key player driving the AI revolution and is closely watched by investors and analysts. Its valuation continues to be shaped by demand for AI chips, innovation in GPU architecture, and its ability to maintain technological leadership amid growing global competition. NVIDIA stands at the intersection of multiple megatrends, making it a critical stock in both the technology and semiconductor sectors.

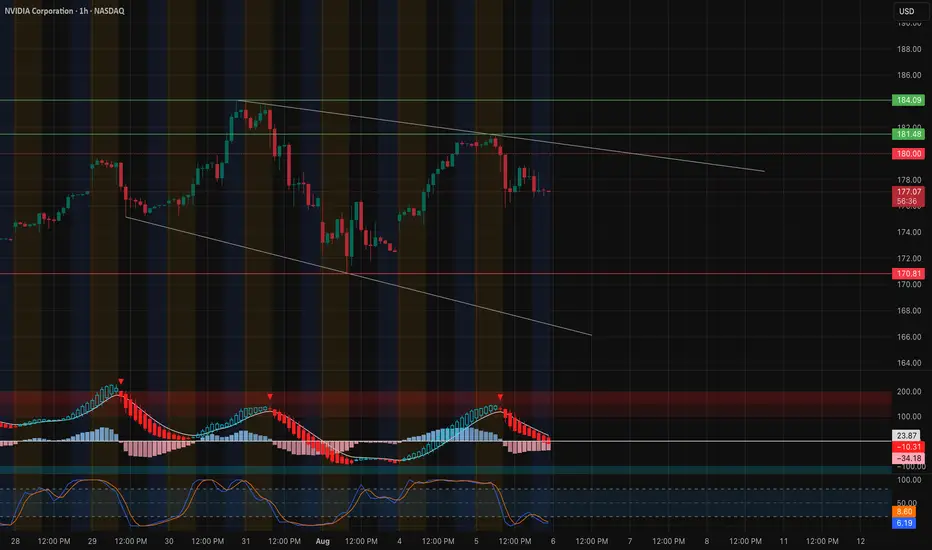
NVDA at a Make-or-Break Level. TA for Aug. 6🚀 NVDA at a Make-or-Break Level — Key GEX & Price Action Signals
Technical Overview (1H Chart)
NVDA is currently trading around 177.15, sitting just under the 180 psychological and technical resistance. Price action remains inside a descending channel, with sellers defending the 180 level while buyers have been active near 175.
The recent bounce from 170.80 aligns with the bottom channel support, but the lack of strong follow-through shows hesitation ahead of heavy resistance.
Gamma Exposure (GEX) Insights
* Major Call Walls:
* 180 → Highest positive GEX & Gamma Wall resistance.
* 184.09–185 → 2nd Call Wall cluster, significant dealer hedging pressure if broken.
* Put Support Zones:
* 175 → Strong GEX-based put support; losing this could accelerate downside.
* 170.80 → Major pivot & prior low, last strong GEX defense.
* Dealers are positioned in a way that staying below 180 keeps upside contained, while a clear breakout above 180 could trigger dealer covering and a squeeze toward 184–185.
Momentum & Oscillators
* MACD → Bearish momentum cooling off but still in the red, suggesting consolidation.
* Stoch RSI → Oversold zone, signaling potential short-term bounce attempt.
Trade Scenarios
* Bullish Case: Break & hold above 180 opens the door for 184–185 retest. Option traders could target near-term calls above 180 with tight stops.
* Bearish Case: Rejection at 180 and drop back under 175 could lead to 170.80 retest. Ideal for puts targeting 175 → 171 zone.
Options Trading Thoughts (Based on GEX)
* Preferred Bullish Setup: Wait for confirmed breakout over 180 → Calls targeting 184 strike, short expiry for momentum.
* Preferred Bearish Setup: Puts if rejection at 180 holds & price slips below 175, targeting 172–171 zone.
Disclaimer: This analysis is for educational purposes only and not financial advice. Always manage your risk.
NVDA Weekly Trade Setup (2025-08-02)
### 🟢 NVDA Weekly Trade Setup (2025-08-02)
🚀 **BULLISH CONSENSUS** across 5 top-tier models
📉 Daily RSI: Weak — but weekly trend is STRONG
💼 Institutional Volume: Confirmed accumulation
📊 Options Flow: Call/Put leaning bullish
---
### 🎯 TRADE SETUP
**💥 Direction:** CALL (LONG)
**📍 Strike:** \$182.50
**📅 Expiry:** 2025-08-08
**💵 Entry:** \$0.73
**🎯 Target:** \$1.46 (100% gain)
**🛑 Stop:** \$0.36 (50% risk cap)
**✅ Confidence:** 75%
**🕒 Entry Timing:** At market open
---
### 🧠 Model Breakdown:
✅ **Grok/xAI:** Weekly bullish, 4/5 signals green
✅ **DeepSeek:** Volume confirms; cautious on daily RSI
✅ **Google/Gemini:** Bullish weekly > bearish daily
✅ **Claude:** Weekly momentum + rising options flow
✅ **Meta/Llama:** All signals aligned for \$182.50 call
---
### ⚠️ Risk Watch:
* Falling Daily RSI = short-term drag risk
* Key Support: Watch for \$178 breakdown
* Earnings/events could spike volatility
---
### 📦 TRADE JSON (for tracking):
```json
{
"instrument": "NVDA",
"direction": "call",
"strike": 182.50,
"expiry": "2025-08-08",
"confidence": 0.75,
"profit_target": 1.46,
"stop_loss": 0.36,
"size": 1,
"entry_price": 0.73,
"entry_timing": "open",
"signal_publish_time": "2025-08-03 00:54:05 UTC-04:00"
}
```
---
🔥 *“Smart money is circling. Ride the wave, not the noise.”*
💬 Drop your thoughts below. Will NVDA break \$185 next week?

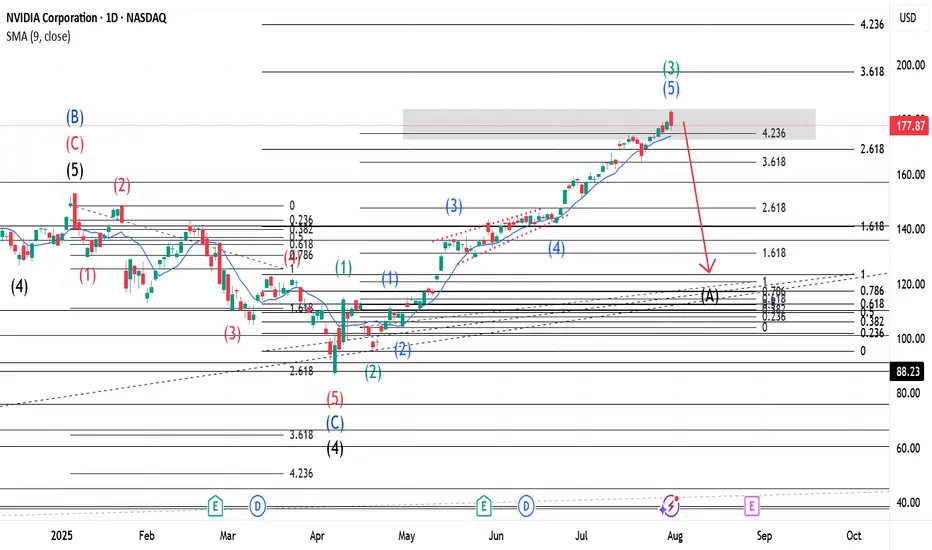
$NVDA ~ An Elliott Wave Breakdown.Earlier in the main wave, our Wave 2(Black) was a Zigzag hence a Flat was expected for Wave 4(Black). Wave B(Blue) closed beyond Wave 3(Black) and our Wave 4 made a 5 wave move(Shown in Red) that retested at the 261.8% Fib. level. With Wave C(Blue) complete, it was coined Wave 4(Black). Wave 5(Black) was launched and has a 5 wave move shown in Green. With a Zigzag for Wave 2(Green), a Flat should be expected for Wave 4(Green). Wave 3(Green) has 5 waves with a triangle for Wave 4(Blue). A confirmation at its current location(423.6% Fib. level) would mean that Wave 3(Green) is complete and a Wave A(Black) of the previously mentioned Flat should be anticipated. Please check my detailed breakdown for a broader perspective into the same.
NB: The placement of Wave A(Black) of the Flat mentioned above is purely for demonstrative purposes.
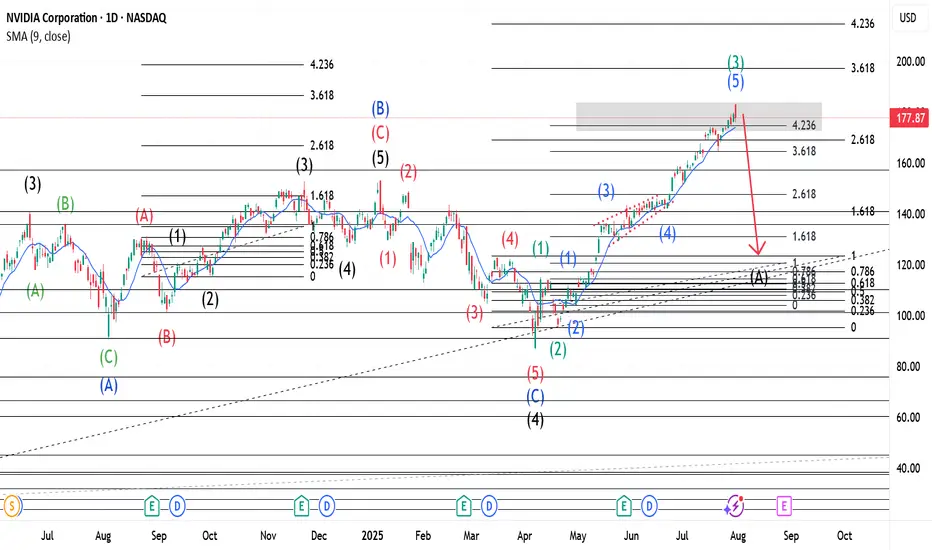
$NVDA ~ An Elliott Wave Breakdown.(Detailed Spectrum)Our Wave 2(Black) of the main wave was a Zigzag hence a Flat for Wave 4(Black). When Wave 3(Black) completed a three wave move, shown in Green, was made, hence A(Blue). Wave B(Blue) went beyond the end of 3(Black) and had 3 waves, shown in Red, also(as expected for Flats). The last of this 3 wave move(Wave c-Red) had 5 waves shown in Black. Upon completion, our Wave B(Blue) was over and we expected a Wave 4(Black). Our Wave 4 made a 5 wave move(Shown in Red) that retested at the 261.8% Fib. level. With Wave C(Blue) complete, it was coined Wave 4(Black). Wave 5(Black) was launched and has a 5 wave move shown in Green. With a Zigzag for Wave 2(Green), a Flat should be expected for Wave 4(Green). Wave 3(Green) has 5 waves with a triangle for Wave 4(Blue). A confirmation at its current location(423.6% Fib. level) would mean that Wave 3(Green) is complete and a Wave A(Black) of the previously mentioned Flat should be anticipated.
NB: The placement of Wave A(Black) of the Flat mentioned above is purely for demonstrative purposes.
$NVDA: Cycle-Wired Levels🏛️ Research Notes
The fact that the angle of linear connection between 3rd degree points (fractal hierarchy) acted multiple amout of times as support and eventually resistance from which tariff drop happened establishing bottom and expanding from there.
That means if we were to justify the texture of ongoing wave from that bottom, we would geometrically quantify the area of that triangle to project considering historic data to remain objective approach (and NOT what levels we subjectively want to see whether we are bullish or bearish). There is mean reversion rule also going on which will be structurally addressed.
No matter where your actual target is at, there are always structural boundaries that price must break through first in order to get there. And because markets tend to move in proportion to their own scale — often aligning with exponents of the golden ratio, we treat phi as a constant within this probabilistic space.

NVDA: 177.87Bullish Entries: 174.00/178.50 Stop 177.00 Target 182.00–184.00
Bearish Entries: 178.50/176.00 Stop 177.00 Target 172.00................Note if you find it somewhat confusing, here is the clarification 178.50 possible bullish reach zone wait for confirmation. 174.00 possible rebound zone or rejection of the bearish entry wait for confirmation for the bearish entry.

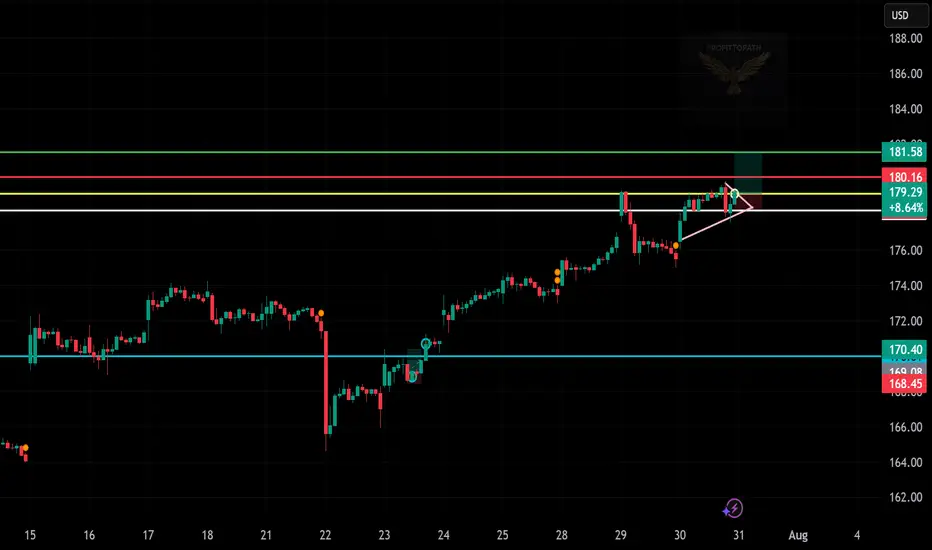
“NVDA Setting Up — Small Triangle, Big Potential”
📈 Trade Snapshot:
NVDA is forming a mini triangle with higher lows. Breakout above $180.16 could push it toward $181.58.
🎯 Setup:
→ Entry: $179.29
→ SL: ~$176.00
→ Target: $181.58
📌 Tight structure + bullish momentum = strong breakout chance.
📋 Hashtags:
#NVDA #BreakoutSetup #PriceAction #ProfittoPath #SwingTrade #SmartMoney #TechnicalAnalysis #ChartSetup
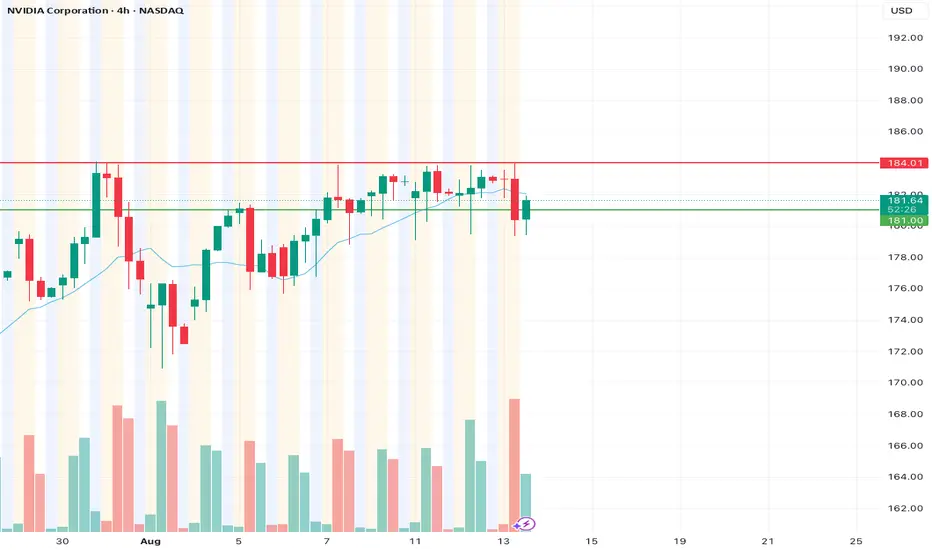
Simple support and resistance for NVDAsupport at 181, resist at 184. earnings coming up, so be careful. exit anything prior to the 29th.
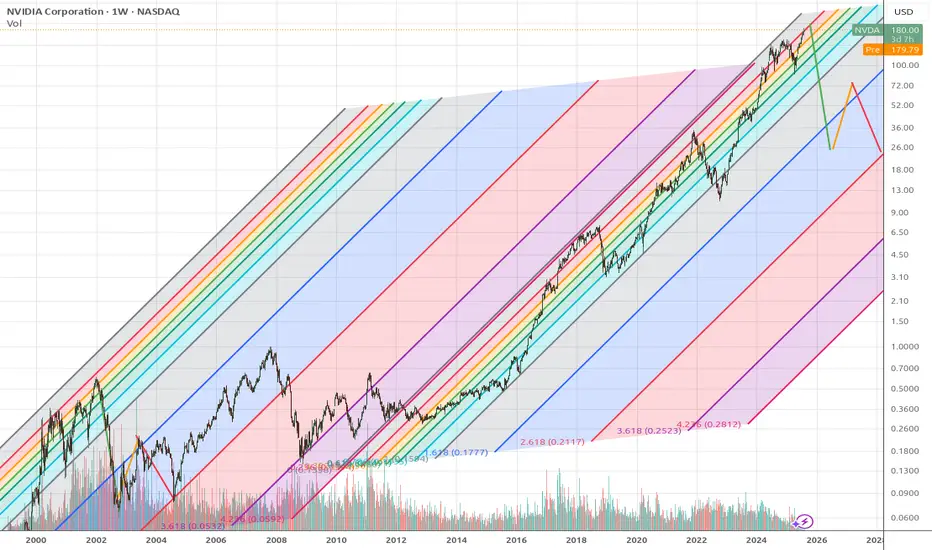
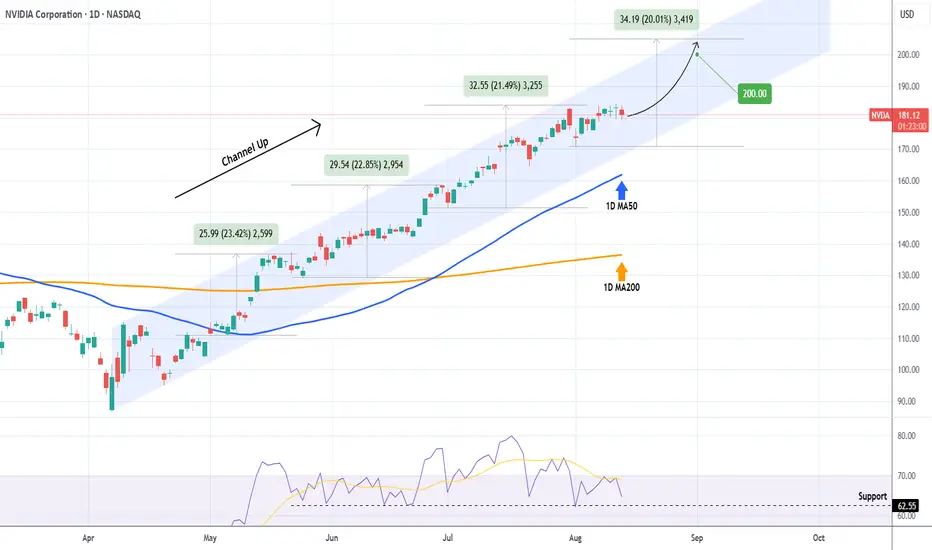
NVIDIA Is the path to $200 that easy?NVIDIA Corporation (NVDA) has been trading within a Channel Up since the April 07 market Low, being so aggressive that it has turned its 1D MA50 (blue trend-line) into Support since May 01.
The last 3 main Bullish Legs all rose by at least +20%. As long as the 1D RSI Support holds, we expect another such Leg, which would be enough for NVIDIA to reach the all important $200 psychological Target.
-------------------------------------------------------------------------------
** Please LIKE 👍, FOLLOW ✅, SHARE 🙌 and COMMENT ✍ if you enjoy this idea! Also share your ideas and charts in the comments section below! This is best way to keep it relevant, support us, keep the content here free and allow the idea to reach as many people as possible. **
-------------------------------------------------------------------------------
💸💸💸💸💸💸
👇 👇 👇 👇 👇 👇
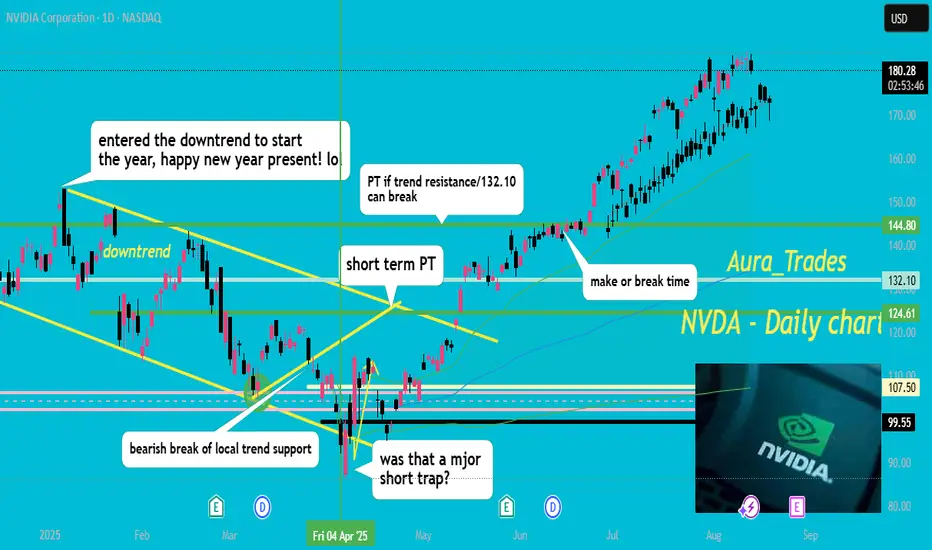
NVDA cant stop wont stop! in my last updated I said watch the 144.80 level.. if we could get a clean daily close over that then 175-200 should follow! well my 175 target is smashed, we could dip to 170 short term but I expect my 200 target to get smashed in the next month ;)
congrats to all longs, see you soon.. boost and follow for more!
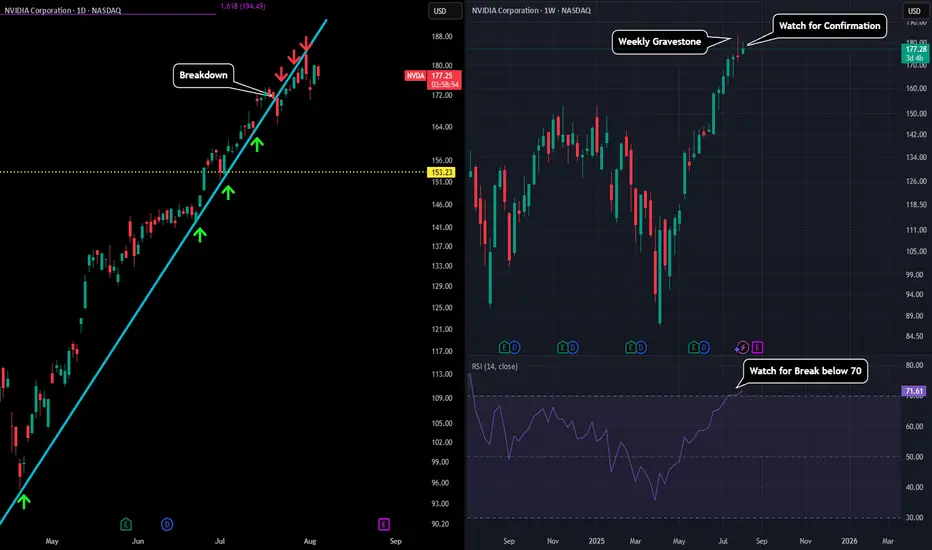
NVDA - Few Warning Signs Please refer to our previous post:
Here we were pointing out the structural break of our blue trendline on the daily. It acted as support the whole way up (green arrows) and now has been flipped into resistance so far (red arrows).
Also if you look at the chart on the right we had a MAJOR bearish signal flash. A weekly gravestone doji formed which could end up marking the top. We haven't had the confirmation yet, but depending on how price action play out this week we could have a very good idea of what next.
If we see bearish momentum and this weekly candle flip red that could be the first sign of this gravestone marking the top as it is a reversal candle. That would also send our strength on the RSI below the 70 which could look as a rejection from overbought conditions.
However, if we are able to maintain this weekly candle green (better yet break the gravestone doji high) that would show strength bouncing from overbought and send us towards that $200 target.
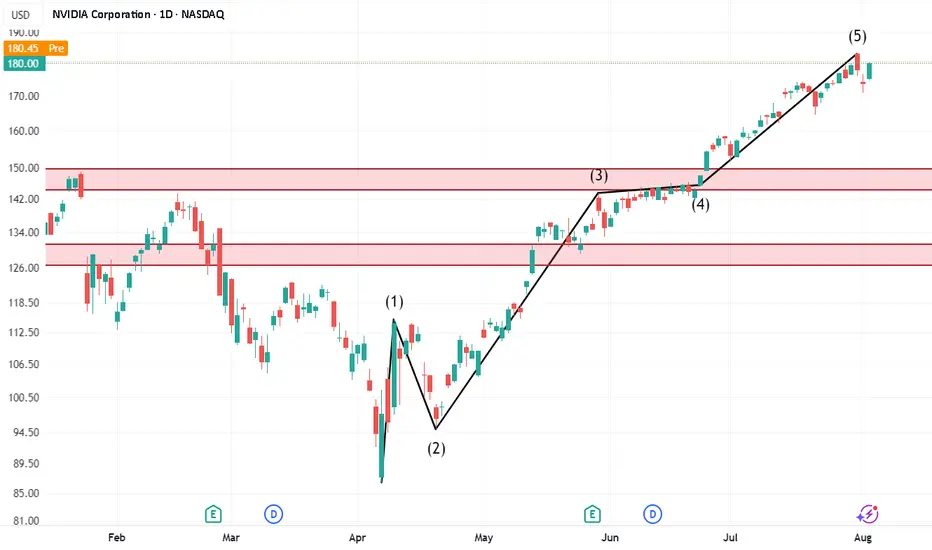
Potential Correction Time: NVDAIt may be the time for NVDA to complete the 5th wave. The next move will become the corrective wave (ABC).
Target price 1: 14x
Target price 2: 13x to 12x
NVDA Short IdeaThis bearish rising wedge just had a failed upside breakout, followed by a 5 wave move to test the lower trendline, and followed by a potential dead cat bounce. I’m short, with stop loss set if new highs are set.
Quantum's TSLA & NVDA Trades 8/1/25Simply breaking down what I look at going into the trading day. Premarket watchlist was short but nailed TSLA short for 150% and could have made double that on TSLA and NVDA longs. Due to hitting my daily goals I had to walk away to avoid overtrading but what an amazing day.

Nvidia Just Under Major SupportNvidia seems to have been pulled down by the Dow just like Apple as both are just under major support. I'm sorry for my previous Nvidia chart that drew support near 140, I recognize where I screwed up, but this chart should be good. Fortunately actual 117 support wasn't that far below and my NVDA isn't too in the red.
NVDA has the lowest revenue multiple in years right now. I know it's well off it's long term trend line, but it's growth rate is unlike anything it's ever been so expecting a steeper trend line to appear makes a lot of sense. Eventually I would imagine we'll get back to that trend line, but not anytime soon.
The Dow hitting major support should finally lift NVDA and the others that have been dragged down like AAPL and AMZN.
Good luck!

NVDA: 175.51Bullish Entries: 178.00 / 180.00 Stop 175.00 Target 184.00 Bearish Entries: 174.00 / 172.00 Stop 177.00 Target 168.00
