NVDA📊 NVIDIA (NVDA) – Daily Chart Technical Analysis
Entry Point:
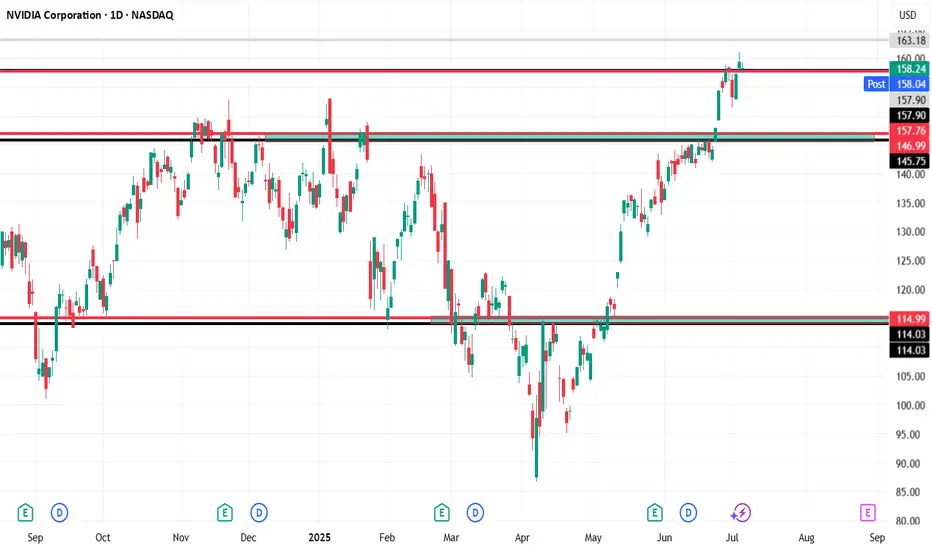
A long position is considered at $158, assuming the price holds above $157.78.
Resistance & Target:
The first target is set at $163, which is a clear resistance zone on the chart based on historical price reactions.
If momentum continues beyond that, higher targets could be considered in future analysis.
Stop Loss:
A tight stop-loss is placed just below key support at $157 to manage risk.
🔄 Weekly Bearish Scenario:
If the price closes below $157, this invalidates the bullish setup:
The first downside target would be $146, which is a previously established support zone.
A further drop could extend toward $115, especially if broader market weakness or sector rotation occurs.
📌 Key Technical Zones:
Support Zones: $157.78, $157.00 (critical for bullish continuation)
Resistance Zones: $158.12, $163.18
Multiple historical rejections and price consolidations are noted near these zones, highlighting their significance.
Summary:
As long as NVDA remains above $157.78, the outlook remains bullish targeting $163. However, a confirmed breakdown below $157 could shift the sentiment sharply bearish, targeting $146 and possibly $115.
NVDA19 trade ideas
NVDA - Going VerticalNVDA has continue to see our near vertical trajectory to the upside.
After yesterday's test of our blue trendline on the daily at $160 price bounced and has now moved up to $170.
Due to the angle of this trend we will break to the downside very soon, but most likely not before some sort of blow off top move towards the $200 level. It is possible we continue to go vertical but just below $200 seems to be where the major level is to see some take profit start occurring.
Also market structure has been super strong which you can see by the retest and hold of the $153 level (yellow dotted line). This was the previous ATH that NVDA recently created as a new level of support with that retest.

NVDA Testing Gamma Ceiling — Eyes on 162.5 🔩 Options Sentiment & GEX Analysis
NVDA is pressing into a critical Gamma Wall at 162.5, which aligns with the highest positive NET GEX and second-tier Call Wall concentration. Dealers are likely short calls here, meaning a breakout could trigger gamma-induced hedging, fueling a squeeze.
* Call Walls: 162.5 → 165 → 167.5 → 170
* Put Walls: 157.5 → 155 → 152
* GEX Skew: Strong bullish exposure into 162.5, suggesting a resistance zone but also potential fuel if breached.
* IVR: 6.6 — Implied Volatility remains cheap, ideal for directional plays.
* IVx Avg: 38.6 — still elevated, giving edge to debit spreads.
* Put/Call Ratio: 0.2% Puts – overly call-heavy positioning adds risk of dealer chasing if breakout occurs.
🧠 GEX-Based Option Trade Ideas
📈 Bullish Gamma Squeeze Play
* Setup: Buy 160/165 Call debit spread (Jul 19 or Jul 26 expiry).
* Trigger: Break & close above 161 with volume.
* Target: 165 → 167.5
* Why: Breaching Gamma Wall at 162.5 opens room to next Call Walls. Dealer hedging could force rapid upside.
📉 Bearish Fade Setup
* Setup: Buy 160/155 Put debit spread
* Trigger: Failure to reclaim 161–162.5 zone with clear rejection pattern.
* Target: 157.5 → 155
* Why: Rejection at GEX ceiling could unwind recent rally, especially if broader market rolls over.
🧭 1-Hour Technical Chart Overview
NVDA is consolidating tightly under its Gamma resistance within a clear ascending channel.
🔍 Structure & SMC Highlights
* Series of Breaks of Structure (BOS) confirms bullish trend.
* CHoCH zones have been retested and flipped bullish around 157.5.
* Current price is compressing under a key supply zone at 160.98–162.5, with rising trendline providing support.
* A clean bullish reaction from the 157.5 order block shows buyer interest is intact.
🔨 Levels to Watch
* Key Resistance: 161 → 162.5 (GEX ceiling, prior swing highs)
* Support Zone: 157.5 → 155 (prior CHoCH and OB zone)
* Trendline: Acting as dynamic support from June lows
📌 Trading Plan (1H Price Action Focus)
Long Setup
* Trigger: Break above 161 with bullish candle close and volume
* Entry: 161.20–161.50
* Stop: Below 159.80 (last demand zone wick)
* Target: 165 first, then 167.5
* Bias: Trend continuation + gamma squeeze
Short Setup
* Trigger: Rejection at 162.5 with bearish engulfing or shooting star
* Entry: 161.80–162.50
* Stop: Above 163
* Target: 157.5 → 155
* Bias: Fade extended rally into gamma wall
🧠 Summary
NVDA is perched just under a powerful options-driven ceiling. Whether this turns into a breakout squeeze or a sharp rejection depends on how price reacts to the 161–162.5 zone. Traders should prepare for both scenarios with defined-risk debit spreads and lean into price confirmation before committing.
This analysis is for educational purposes only and does not constitute financial advice. Always do your own research and manage risk carefully.

NVDA Analysis To 164?Quick breakdown of NVDA
Appears we hit our corrected level, we could go deeper possibly or hold at this level and drive up to 164
This is looking like a nice little setup long indeed
Trade Smarter Live Better
Kris/Mindbloome Exchange

NVDA Support and Resistance Lines Valid from July 1 to 31st 2025Overview:
These purple lines act as Support and resistance lines when the price moves into these lines from the bottom or the top direction. Based on the direction of the price movement, one can take long or short entries.
Trading Timeframes
I usually use 30min candlesticks to swing trade options by holding 2-3 days max. Anyone can also use 3hr or 4hrs to do 2 weeks max swing trades for massive up or down movements.
I post these 1st week of every month and they are valid till the end of the month.

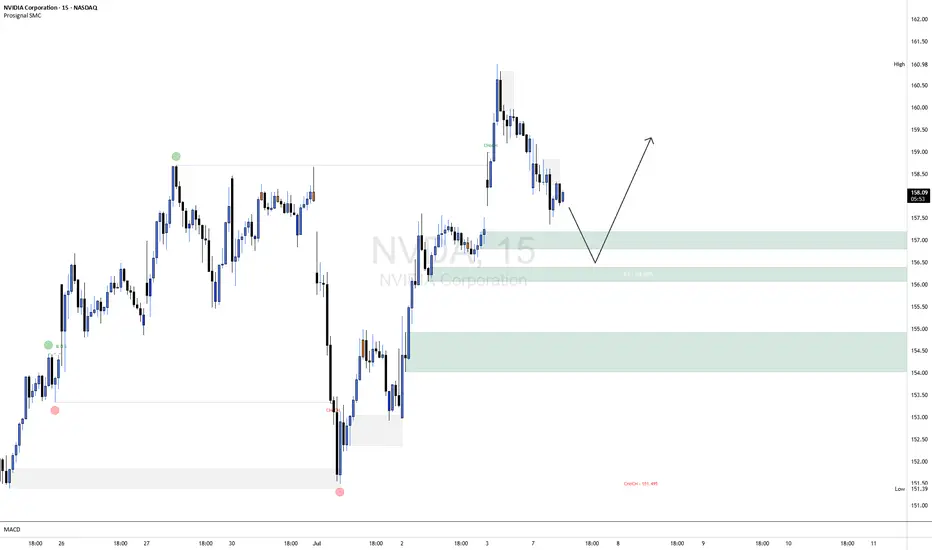
NVDA ShortNVDA is currently exhibiting short-term bearish order flow on the 15-minute chart, with price making lower highs and lower lows following a clear CHoCH (Change of Character) to the downside. The current leg suggests continued weakness as price retraces toward the highlighted bullish order block around the 156.20–157.00 range, aligning closely with the 50% equilibrium level of the last bullish impulse.
This area represents a high-probability demand zone where we anticipate a potential bullish reaction. A confirmation entry (e.g., bullish BOS or lower timeframe CHoCH within the OB) will be required to validate a long setup from this zone. Should confirmation present itself, upside targets can be trailed back toward recent highs near 159.00–160.00.
Risk Management Note:
Always wait for confirmation before entering against the prevailing short-term trend. Use a well-defined stop-loss below the order block and calculate your position size based on your overall risk tolerance (typically 0.5–1% of account equity per trade). Avoid overleveraging, and remember that patience and discipline are key to capital preservation.
NVDA$ - possible pullback to $50 (-67% from pick) in the making.NASDAQ:NVDA have done this before (67% pullbacks after long rally).
NVDA is following very predictable patterns for many years now, despite excitement around this stock - stock made "new recent low" and current rally maybe just a part of a "head and shoulders" in the making. If "new all time high" is not reached with in the next few weeks - we will see stock pullback to $50 or less in the next 6-9 month.

(NVDA) Long Pre-Market position off of previous support. Should wick down, grab liquidity then continue upwards.

NVIDIA NVIDIA (NVDA) CORP IS LEADING IN AI CHIPS
NVIDIA closed the week in a massive green candle at $159.34 , marking a new all-time high.
NVIDIA’s market capitalization is approximately $3.89 trillion, making it the world’s most valuable publicly traded company as of July 2025.
Financial Performance
Q1 Fiscal 2026 (ended April 27, 2025):
Revenue: $44.1 billion (up 12% quarter-over-quarter, up 69% year-over-year)
GAAP EPS: $0.76; Non-GAAP EPS: $0.81
Gross Margin: 60.5% (61.0% non-GAAP), impacted by a $4.5 billion charge related to US export restrictions to China
Fiscal 2025 (ended January 2025):
Revenue: $130.5 billion (up 114% year-over-year)
GAAP EPS: $2.94 (up 147% year-over-year)
Non-GAAP EPS: $2.99 (up 130% year-over-year)
Business Highlights
AI and Data Center Leadership:
NVIDIA’s explosive growth is driven by surging demand for its AI chips, especially in data centers. The company’s Hopper and Blackwell GPU platforms are in high demand, with Blackwell samples now shipping to partners and customers.
Robotics and Automotive Expansion:
Robotics is emerging as a major growth area. NVIDIA’s robotics and automotive division generated $1.7 billion in revenue last year, with projections to exceed $7.5 billion by the early 2030s. The company recently unveiled the AEON humanoid robot and continues to invest in platforms for autonomous vehicles and industrial automation.
Product Innovation:
At Computex 2025, NVIDIA announced new AI infrastructure technologies, including NVLink Fusion and the Isaac GR00T-Dreams platform for robotics. The company is also expanding into custom AI server solutions and ARM-based CPUs for PCs and servers.
NVIDIA remains moderately bullish, the Bullish scenarios/probability could potentially reclaim $200–$250 per share in 2025 if AI demand accelerates and China market headwinds ease.
Growth Drivers:
Continued AI adoption across industries
Expansion in robotics, automotive, and cloud infrastructure
Strategic partnerships and global supply chain investments
Recent News
Market Leadership:
NVIDIA briefly surpassed Microsoft and Apple to become the most valuable company in history, with a market cap nearing $3.92 trillion.
Dividend:
The next quarterly cash dividend of $0.01 per share was paid on July 3, 2025.
Summary Table
Metric Value (July 2025)
Stock Price $159.34
Market Cap $3.89 trillion
Q1 FY26 Revenue $44.1 billion
Q1 FY26 EPS $0.76 (GAAP), $0.81 (non-GAAP)
Fiscal 2025 Revenue $130.5 billion
Fiscal 2025 EPS $2.94 (GAAP), $2.99 (non-GAAP)
Dividend (Quarterly) $0.01/share
NVIDIA remains the global leader in AI and accelerated computing, with record financial results, a dominant market position, and ambitious expansion into robotics and next-generation computing platforms.
#NVIDIA #AI #STOCKS

NVIDIA (NVDA)-Trade PlanNVDA, After an explosive run powered by GenAI infrastructure and bullish earnings, the chart is setting up for either a bullish continuation or a healthy pullback.
With volatility tightening and volume compressing, this is a great moment to prepare for either breakout or breakdown scenarios.
🎯 Trade Plan – Tiered Long Setup
📌 Entry Zones (Tiered Buying):
🔹 $150
🔸 $140
🔻 $120
📈 Profit Targets:
TP1: $160
TP2: $175
TP3: $200+ – Long-term continuation play if AI macro momentum persists
📌 DISCLAIMER: This idea is for educational purposes only. Always use proper risk management and assess your own strategy

NVIDIANVIDIA is due for correction, anytime it can start. This week probably would be a good week to start the correction.
Disclosure: We are part of Trade Nation's Influencer program and receive a monthly fee for using their TradingView charts in our analysis.

NVDA at a Make-or-Break Zone – Trade Setups Ahead 🔍 Options GEX Insights (Gamma Exposure):
* GEX Map Observation:
* NVDA is currently trading near 158, slightly under the major Gamma Wall at 160.98.
* This level marks the highest positive net GEX – strong resistance due to heavy call positioning.
* Above that, additional call walls stack at 162.5 → 165 → 167.5, creating a squeeze zone if price breaks out.
* Below, support levels sit at 155 (2nd PUT wall) and 152.5 (3rd PUT wall).
* Volatility & Options Sentiment:
* IVR: 8.8, IVx: 40.8 – low implied volatility rank = cheap options.
* Put Positioning: Only 1.4% = call-heavy environment, skewed bullish.
* Positive GEX (+) across expiries shows dealers will hedge upward if we move beyond 161.
🟢 Bullish Scenario (Breakout/Squeeze Setup):
* Break over 160.98 could ignite a gamma squeeze toward 165–167.5 range.
* Ideal for low delta CALL verticals or debit spreads targeting the 165 zone.
* Weekly options are cheap due to low IV.
🔴 Bearish Rejection Scenario:
* If price stays pinned under 160 and loses 155, dealers start to de-hedge – momentum toward 152/150.
* Consider put spreads or a cautious fade if it breaks structure.
📌 GEX Summary Suggestion:
If NVDA stays under 160, price may remain pinned or retrace. But above 161 opens the gamma doors to 165+. Cheap IV = opportunity.
📊 1-Hour Price Action Technicals:
* Market Structure:
* Previous BOS toward the upside has stalled inside a consolidation box under 160.
* Multiple CHoCH zones form below current price, hinting at exhaustion.
* Price is stuck within a wedge, coiling beneath resistance = compression phase.
* Support & Resistance Zones:
* Resistance: 159.34 → 160.98 (Gamma Wall and price supply).
* Support: 155.34, then 151.10.
* Bullish OB remains untested around 151 area if price flushes.
* Volume & Trend:
* Volume declining during chop = balance phase.
* RSI & MACD show slight bearish divergence, favoring caution near top of range.
⚙️ Trade Thoughts:
* Scalp Setup:
* Above 160.98 = scalp long toward 162.5/165, tight stop at 159.3.
* Below 155 = scalp short toward 152 zone.
* Swing Setup:
* Long only on strong breakout close above 161 with volume.
* Short swing possible under 155 if CHoCH confirms trend flip.
Conclusion:
NVDA sits at the pivot point of either breaking out toward 165+ or rejecting and retracing toward 152. GEX and price both hint at a coiled move ahead. Stay nimble, follow the volume.
Disclaimer: This analysis is for educational purposes only and does not constitute financial advice. Trade at your own risk.

How To Spot The Breakout In 3 Steps Or More..In this video we dive into how to spot the breakout
but here is a catch we are using the Stochastic RSI
to spot these breakouts.
Also this spotting of these breakouts is happening
together with the Rocket booster
strategy.
Watch this video to learn more.
Disclaimer:Trading is risky please learn risk management and profit
taking strategies.Also feel free to use a simulation trading account
before you trade with real money.

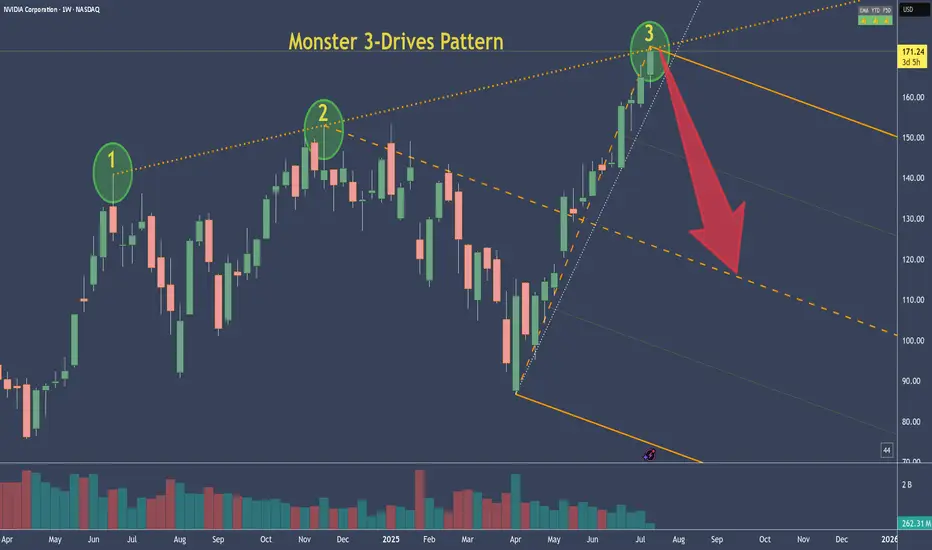
NVDA - NVIDIA's 3-Drive Pattern target if it plays outThis is the weekly chart of NVDA.
We can clearly see a 3-Drives pattern forming.
If this pattern plays out, the centerline would be my target. Of course, it's still too early to short.
But I’ve got my hunting hat on and I'm watching for signals on the daily chart.
One would be a break of the slanted trendline—but there are a couple of other conditions that need to align as well.
Always ask yourself: What if?
NVDA Update: Breakout Fading or Wedge Still in Play?In my last post, I highlighted the rising wedge pattern forming at the top of NVDA’s strong rally. Price briefly pushed above the upper wedge resistance and tagged $172.40, but today’s session printed a bearish close at $170.70 — just above the breakout level, but with no real follow-through.
Volume came in higher, but price action failed to extend the breakout, suggesting this could be a stall or even a false breakout in progress. RSI remains overbought, and momentum may be slowing despite the recent push.
If price slips back below $168, we could see the original wedge breakdown scenario come back into play. Watch for support around:
🔹 $151.31–148.67
🔹 Below that: $125 zone
For bulls, continuation above $172.40 with strong volume would invalidate this pattern and confirm breakout strength. Until then, caution is warranted.

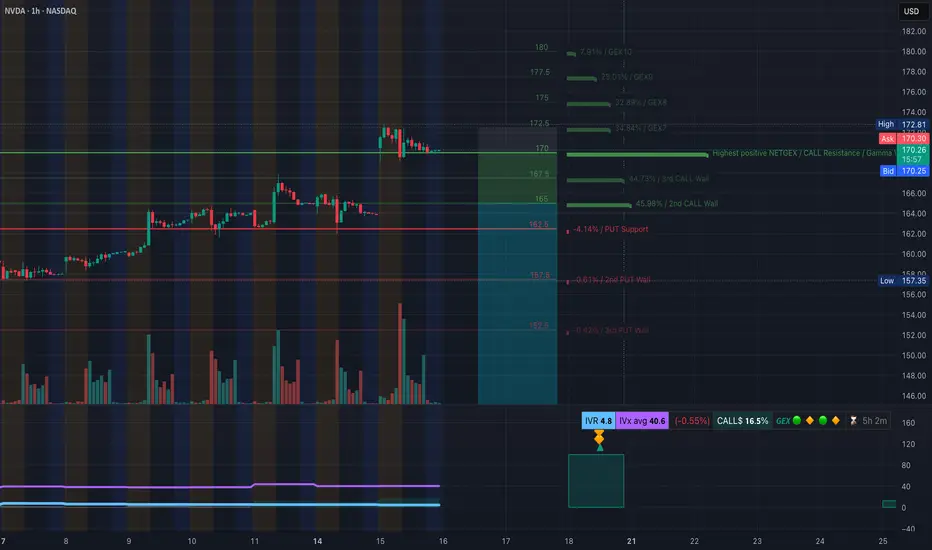
NVDA Bulls in Control Above $170? TA for July16Options Flow and Technical Setup🔥
🧠 GEX & Options Flow Analysis
* GEX Map Summary:
* Highest Call Wall & Gamma Resistance: $172.50
* Major GEX Clusters: $175–$178 → Layered GEX zones, strong positive sentiment
* PUT Support: $162.5 — This is the highest negative NetGEX zone and key downside defense
* IVR: 4.8 (Low)
* IVx: 40.6 (Decaying vol environment)
* Options Skew: 16.5% CALL-dominant bias — Traders leaning bullish.
🧩 Options Trading Suggestions:
* Bullish Play (Preferred Bias):
* Above $170, bulls can look for a push into $172.5 → $175 range.
* Suggested Strategy:
* Buy: $172.5 or $175 CALL (0DTE or 7/19 expiry)
* Condition: NVDA must hold above $170.00 on pullbacks
* Risk: Use $167.5 as a mental stop
* Target: $175–$178 possible gamma magnet if volume kicks in
* Bearish Hedge (if 170 fails):
* Below $167.5, NVDA could revisit $165 or $162.5 PUT wall
* Put Entry Idea: $165 PUT (7/19)
* Only if price shows CHoCH + BOS confirmation
🧠 1H Chart + SMC Price Action Breakdown
* Market Structure: BOS continuation → price consolidating below BOS high
* Current Box: NVDA trapped in a tight SMC range between $167.89–$172.81
* CHoCH Zone: None yet. We’re in a healthy bull flag consolidation pattern
🔍 Trading Scenarios:
* Bullish Setup:
* Wait for breakout above $172.5
* If price closes above and retests → long to $175, $178
* Alternatively, accumulate calls if price bounces from $170 with strength
* Bearish Setup:
* Watch $167.89 → a CHoCH and BOS below this opens $165, $162.5
* Be cautious: this is a bullish structure unless macro news hits
✅ Final Thoughts:
NVDA remains one of the strongest charts on the board. The consolidation under $172.5 is healthy, and GEX flow shows bullish momentum building. As long as $170 holds, this setup favors long trades, especially toward $175–$178.
Disclaimer: This analysis is for educational purposes only and not financial advice. Always do your own due diligence and manage risk properly.
NVDA Follow-Up: Breakout Holding, But Still on Thin IceIn yesterday’s post, I highlighted the rising wedge pattern and noted that a breakout above $168 needed strong follow-through to confirm. Today, NVDA managed to hold above that level, closing at $171.37, just beneath the recent high of $172.40.
So far, the breakout attempt is intact — but not yet convincing.
🔹 Volume came in lighter, suggesting buyers aren’t fully committed
🔹 The candle printed a modest gain, but without expanding range or momentum
🔹 Price is still riding above the rising wedge, but hasn’t cleared resistance with authority
As long as NVDA stays above $168, bulls remain in control — but a daily close back below that level would re-enter the wedge and raise the risk of a false breakout, putting $151–148 back on the radar.
Until we see a strong breakout above $172.40 with volume, this remains a cautious breakout, not a confirmed one.

NVDA GEX Analysis for Options Trading. Jul 7Gamma Exposure (GEX) Insights – July 5, 2025
* 📍Key Gamma Wall (Resistance):
→ 160.98 — Highest positive GEX level (strong call wall / gamma resistance).
→ 162.5 — Next large call wall, acting as a magnet or rejection pivot.
→ 165 / 170 — Thin GEX above = squeeze zone if breakout occurs.
* 🧲 Support Side:
→ 152.5 – 150: HVL + Put Support + GEX pocket.
→ 140: Second PUT wall, deeper support if breakdown worsens.
* 📉 IV Sentiment:
→ IVR: 5.6, IVx avg: 37.9 = Low implied volatility.
→ Current IV crush environment favors debit call spreads or directional long calls with tight risk.
* 📊 Call/Put Flow:
→ Calls: 3.3%, Puts: -0.53%
→ Slight bullish bias but not overcrowded — room for gamma expansion.
🔄 Options Trade Setups Based on GEX
Bullish Gamma Squeeze Setup:
🟢 Trigger: Price breaks and holds above 161.
🧨 Target: 165 → 170 (thin GEX zone could cause sharp move).
🛡️ Strategy: Buy 160C / Sell 165C (debit spread) or long 162.5C with defined stop.
⛔ Stop: If NVDA fails to hold above 158.
Bearish Gamma Rejection Setup:
🔴 Trigger: Rejection at 160.98–162.5 zone with volume fade.
🎯 Target: 156.5 → 152.
🛡️ Strategy: Long 160P / Short 155P (bear put spread) or short 162.5C naked if IV allows.
⛔ Stop: Breakout above 162.5 invalidates this setup.
📈 1-Hour Chart Technical Analysis
Structure & Price Action:
* NVDA is in bullish market structure, forming higher lows with a clean CHoCH → BOS → retest play.
* It reclaimed the 159.20 level and is testing the 160.98–162.5 zone — a key area where momentum traders will engage.
Zones to Watch:
* Support:
→ 156.68 (minor swing support)
→ 153–152 OB zone (valid bullish OB + HVL)
* Resistance:
→ 161–162.5 (GEX resistance + supply)
→ Above 162.5 opens room to 165+
Trend & Volume:
* Strong bullish candle breaking BOS.
* Volume picked up during BOS, but follow-through needs to come with breakout candles or retest hold.
🔍 My Suggestions for Intraday/Swing Traders:
✅ Bullish Setup:
If NVDA holds above 159.20 and reclaims 161, enter on retest of 160.50.
TP1: 162.5
TP2: 165
SL: Below 157.80
❌ Bearish Setup:
If price gets rejected near 162 and breaks below 157.80 → short retracement to 153.
TP1: 156.5
TP2: 152
SL: Above 162.50
My View:
Currently bullish bias but entering a decision zone. Wait for clean breakout with volume, or short rejection if momentum fades. Keep GEX in mind — above 162.5 has little resistance and can rip.
This breakdown is for educational purposes only and not financial advice. Always manage your risk before taking a trade.

Inevitable Pull Back Coming Soon?| NVDA TSLA AAPL AMZN META MSFTStock market Forecast | QQQ SPY CME_MINI:NQ1! CME_MINI:ES1!
Mag 7 FORECAST| NASDAQ:NVDA NASDAQ:TSLA AAPL AMZN META MSFT July 2025 Forecast

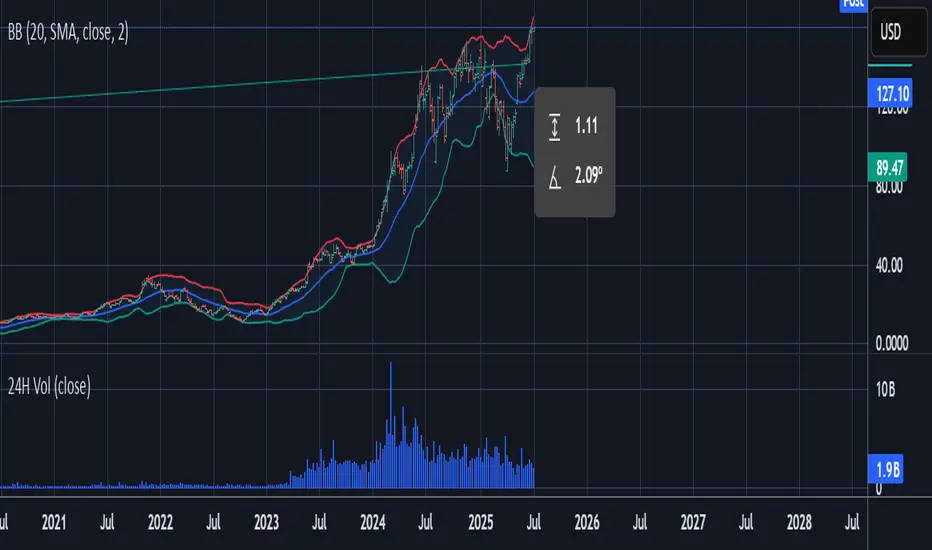
NVDIA to 185 or Higher base Trend ExtensionInitial Impulse Move (P1 to P2): The strong upward movement from $90.33 to $153 shows significant bullish momentum.
Healthy Retracement (P2 to P3): The pullback to $87 represents a deep correction—deeper than the starting point, suggesting a potential shakeout before resuming upward.
Extension Projection: Using the 1.618 level from this wave structure, the projected price of ~$187 serves as a potential target or resistance level where price may react or consolidate.
Technical Significance: The 1.618 level is often used by traders to anticipate where profit-taking or trend exhaustion may occur in strong moves, especially after a retracement.

NVIDIA (NVDA) 4H Setup – Rocket Booster Strategy Building🚀 NVIDIA (NVDA) 4H Setup – Rocket Booster Strategy Building Momentum After Gap-Up and Volume Spike 📈
NVIDIA (NVDA) is showing early signs of another bullish
continuation on the 4-hour chart, echoing a similar pattern seen recently on Microsoft. This setup fits well within the Rocket
Booster Strategy framework — a method focused on catching strong trend acceleration signals backed by confluence.
Here’s what’s happening on NVDA’s chart:
1. High Volume on the 4H Candle
There’s been a strong increase in volume on a bullish 4H candle, indicating significant interest at current levels. This suggests
accumulation or breakout positioning, typically a good sign ahead of momentum bursts.
2. Stochastic RSI Between 50 and 20
While the Stochastic RSI hasn’t bounced from the oversold zone yet, it’s hovering between 50 and 20 — a zone that often acts as a
launching point for continued upward momentum. This shows that buyers are gradually regaining control without being overextended.
3. Price Above the 50 EMA and 200 EMA
NVDA is currently trading well above both the 50 EMA and 200 EMA on the 4-hour chart. This bullish structure confirms a strong
underlying uptrend, and it gives added confidence to long positions.
4. Bullish Gap-Up
A gap-up occurred recently, further confirming buying pressure. Gaps during trending conditions often signal the start of a new
impulsive wave, especially when backed by rising volume and clean trend structure.
Strategy Context
This is a textbook setup for the Rocket Booster Strategy, though the Stochastic RSI is not fully reset. Instead, it’s showing a more
gradual buildup of strength — which can be an early entry signal before larger players pile in.
Entry: On 4H candle continuation or brief intraday retracement
Stop Loss: Below the gap or recent support
Target: Previous swing highs or Fibonacci-based extensions
Final Thoughts
NVIDIA is showing strong signs of bullish continuation, and this could be the early stage of a new momentum phase. The
Stochastic RSI position adds a slightly different flavor to the setup
— more of a buildup than a reversal — but the overall structure remains solid. As always, risk management is key.
Let me know in the comments if you’re watching NVDA too or already in the trade. More setups like this coming soon.
🔥 Rocket Booster Strategy: Engaged for NVDA?
Disclaimer:
This analysis is for educational and informational purposes only. It does not constitute financial advice or a recommendation to buy or sell any security.
Always do your own research and consult a licensed financial advisor before making any trading decisions. Trade at your own risk.

$NVDA – Going Long Long LONGTaking a long position here at $98 – yes, despite the noise.
There’s no denying the pressure across semiconductors following renewed tariff threats from the Trump administration. But I believe this is more short-term overreaction than long-term damage. Any meaningful negotiation or de-escalation could act as a slingshot for these names, especially leaders like Nvidia.
Nvidia's fundamentals remain incredibly strong. The company is still outpacing its peers in AI, data centers, and gaming hardware. Profitability remains intact, and there’s no indication of a breakdown in their competitive edge.
Technicals are giving us some strong signals:
We're seeing a long-term bullish divergence forming.
RSI is approaching oversold territory – rare for Nvidia and historically a signal for strong bounces.
Price is nearing key long-term support levels that held in previous cycles.
I'm positioning early here because I believe the broader market is mispricing geopolitical risk. If the situation improves – and it often does faster than expected – NVDA is one of the first names that will rebound aggressively.
Let’s see how this plays out, but I’m confident this is a high-conviction entry point in the 80's and 90's.
