PLANB : VCP patternStrategy : Swing Trade
Trade Set Up : VCP pattern + Wave 5
Entry at 8.80
Entry 2 after pass Fibo 61.8 = 9.00
Stop loss at 8.55, 8.65
TP at Previous high 9.90
RR 2.86,4
PLANB trade ideas

PLANB | Elliott Wave Projection - Leading Diagonal 5-WavePrice action and chart pattern trading
> Wave projection - Leading diagonal pattern with a possible 5-wave uptrend
> Entry @ pullback and breakout downtrend line wave 2 and wave 4 near lower support of uptrend wave channel.
> Target @ previous primary wave 3 | 0.786 - 1.0 zone +30% upside
> Stoploss @ upcoming wave 3 and upcoming wave 5 zone -10% downside
> Risk reward ratio 2:1
Always trade with affordable risk and respect your stoploss

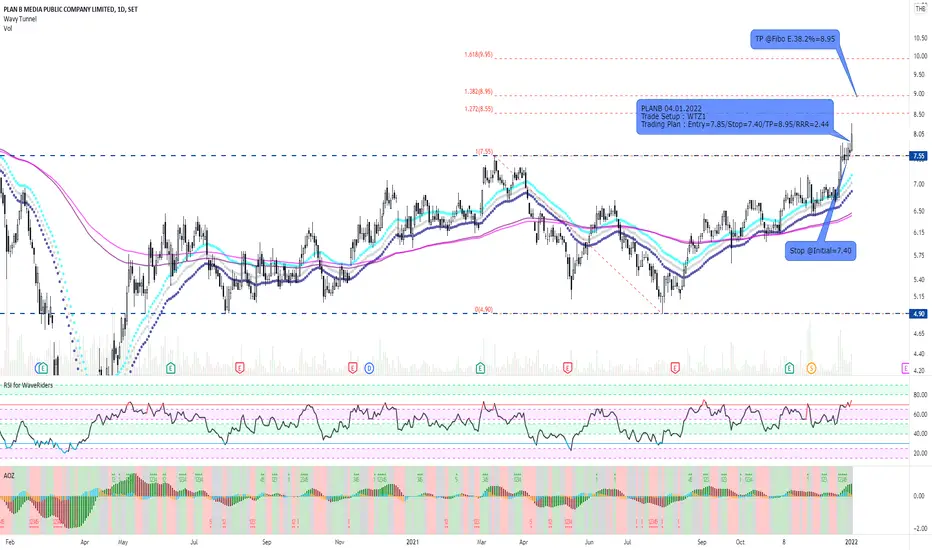
PLANB and WTZ1 SetupPLANB just broke out the range after retraced the upper range and hit the new high. We expected the next fibo E. level could be the next target as the same level of the previous high.


20190627 PLANB set a new all-time-highA weekly graph of PLANB today set an all-time-high price of 7.70 passing over the previous one of 7.60 reached several years ago. The CC59 counting currently at +5 candle. Although investors with "trading the nine" plan are waiting to take profit when the counting reaches +9, this new uptrend can also be trailed to end when the candle make a price level lower than that of its immediate neighbor on the left.

20181228 Case study of trading the 9 in SET:PLANB weekly graph.
With use of Graph Reader Pro 4.0 for TradingView, trading opportunities in a Thai advertising company SET:PLANB are easily spotted in a weekly graph. Price movements of PLANB have been in "Lightning" patterns as shown as green arrow paths in the picture. When the CC59 counting progress up to -9 or +9, price reversals tend to follow. A count to -9 suggests an opportunity to buy PLANB itself or its corresponding CALL derivative warrants (if available in the market). On the other hand, a count to +9 suggests an opportunity to buy PUT derivative warrants referencing PLANB's price (if available in the market).

