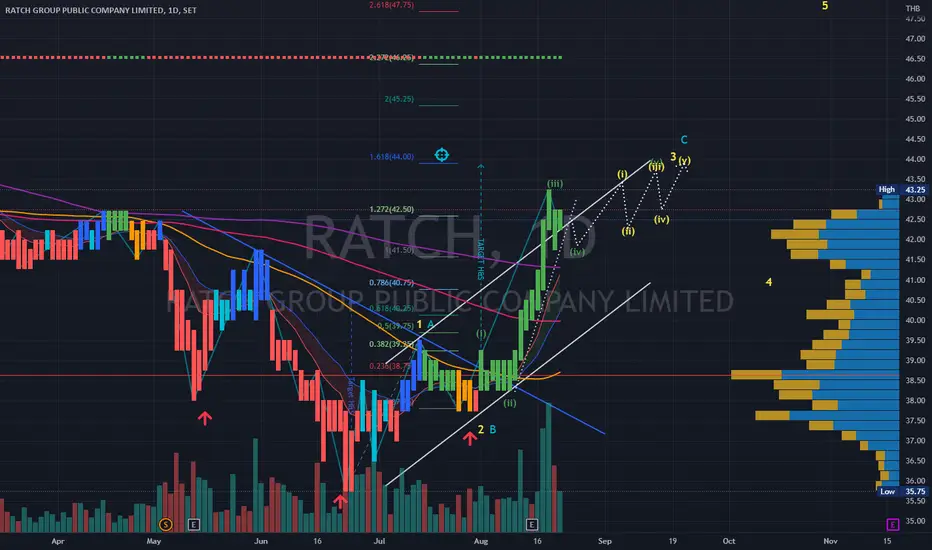
RATCH | Elliott Wave Analysis -Uptrend rising wedge projectionPrice action and chart pattern trading - take profit position
> Rising/Bearish Wedge false breakout wave iv correction
> Target Inverted Head & Shoulders 1.618 extension of wave 1 or A
> Recommend take some profit along upcoming wave (iii) of wave v of wave 3 or C should be the longest wave.
> Indi
Next report date
—
Report period
—
EPS estimate
—
Revenue estimate
—
2.75 THB
6.13 B THB
33.46 B THB
981.03 M
About RATCH GROUP PCL
Sector
Industry
CEO
Nitus Voraphonpipat
Website
Headquarters
Nonthaburi
Founded
2000
ISIN
TH0637010Y00
FIGI
BBG000C79T98
Ratch Group Public Co. Ltd. engages in the business of investing in companies to generate and sell electricity and to develop power energy projects and infrastructure projects. It operates through the following segments: Domestic Electricity Generating, Renewable Energy, International Power Projects, and Related Business and Infrastructure. The company was founded by Boonchoo Direksathapon on March 7, 2000 and is headquartered in Nonthaburi, Thailand.
Related stocks
RATCH| Elliott Wave Projection | Inverted H&S Reversal Pattern Price action and chart pattern trading setup
> Elliott Wave projection - downtrend final correction position with an expanding diagonal pattern.
> Inverted head & shoulders reversal pattern in TFD with bullish engulfing candlestick
> Indicator: RSI strong bullish signal cross above MA and MACD golde


Left Menu Pane (THAI Language): Beginner LevelHow to use "Text" menu on the left pane to insert text and important information into your chart

See all ideas
Summarizing what the indicators are suggesting.
Neutral
SellBuy
Strong sellStrong buy
Strong sellSellNeutralBuyStrong buy
Neutral
SellBuy
Strong sellStrong buy
Strong sellSellNeutralBuyStrong buy
Neutral
SellBuy
Strong sellStrong buy
Strong sellSellNeutralBuyStrong buy
An aggregate view of professional's ratings.
Neutral
SellBuy
Strong sellStrong buy
Strong sellSellNeutralBuyStrong buy
Neutral
SellBuy
Strong sellStrong buy
Strong sellSellNeutralBuyStrong buy
Neutral
SellBuy
Strong sellStrong buy
Strong sellSellNeutralBuyStrong buy
Displays a symbol's price movements over previous years to identify recurring trends.
R
RHSG4929986
RH International (Singapore) Corporation Pte. Ltd. 4.5% 27-MAR-2028Yield to maturity
5.26%
Maturity date
Mar 27, 2028
See all RATCH bonds
Frequently Asked Questions
The current price of RATCH is 25.50 THB — it has decreased by −0.97% in the past 24 hours. Watch RATCH GROUP PCL stock price performance more closely on the chart.
Depending on the exchange, the stock ticker may vary. For instance, on SET exchange RATCH GROUP PCL stocks are traded under the ticker RATCH.
RATCH stock hasn't changed in a week, the month change is a 3.24% rise, over the last year RATCH GROUP PCL has showed a −7.27% decrease.
We've gathered analysts' opinions on RATCH GROUP PCL future price: according to them, RATCH price has a max estimate of 40.00 THB and a min estimate of 25.00 THB. Watch RATCH chart and read a more detailed RATCH GROUP PCL stock forecast: see what analysts think of RATCH GROUP PCL and suggest that you do with its stocks.
RATCH reached its all-time high on Oct 25, 2019 with the price of 79.00 THB, and its all-time low was 11.50 THB and was reached on Dec 4, 2000. View more price dynamics on RATCH chart.
See other stocks reaching their highest and lowest prices.
See other stocks reaching their highest and lowest prices.
RATCH stock is 0.98% volatile and has beta coefficient of 0.76. Track RATCH GROUP PCL stock price on the chart and check out the list of the most volatile stocks — is RATCH GROUP PCL there?
Today RATCH GROUP PCL has the market capitalization of 55.46 B, it has increased by 2.23% over the last week.
Yes, you can track RATCH GROUP PCL financials in yearly and quarterly reports right on TradingView.
RATCH GROUP PCL is going to release the next earnings report on Aug 18, 2025. Keep track of upcoming events with our Earnings Calendar.
RATCH net income for the last quarter is 1.22 B THB, while the quarter before that showed 641.58 M THB of net income which accounts for 90.10% change. Track more RATCH GROUP PCL financial stats to get the full picture.
RATCH GROUP PCL dividend yield was 5.33% in 2024, and payout ratio reached 56.80%. The year before the numbers were 5.08% and 67.35% correspondingly. See high-dividend stocks and find more opportunities for your portfolio.
EBITDA measures a company's operating performance, its growth signifies an improvement in the efficiency of a company. RATCH GROUP PCL EBITDA is 6.62 B THB, and current EBITDA margin is 20.73%. See more stats in RATCH GROUP PCL financial statements.
Like other stocks, RATCH shares are traded on stock exchanges, e.g. Nasdaq, Nyse, Euronext, and the easiest way to buy them is through an online stock broker. To do this, you need to open an account and follow a broker's procedures, then start trading. You can trade RATCH GROUP PCL stock right from TradingView charts — choose your broker and connect to your account.
Investing in stocks requires a comprehensive research: you should carefully study all the available data, e.g. company's financials, related news, and its technical analysis. So RATCH GROUP PCL technincal analysis shows the buy rating today, and its 1 week rating is sell. Since market conditions are prone to changes, it's worth looking a bit further into the future — according to the 1 month rating RATCH GROUP PCL stock shows the sell signal. See more of RATCH GROUP PCL technicals for a more comprehensive analysis.
If you're still not sure, try looking for inspiration in our curated watchlists.
If you're still not sure, try looking for inspiration in our curated watchlists.