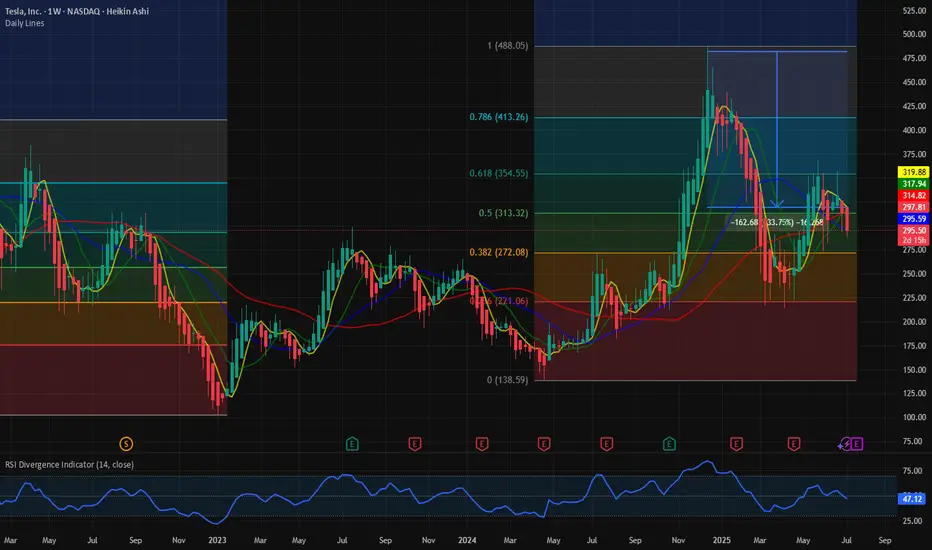
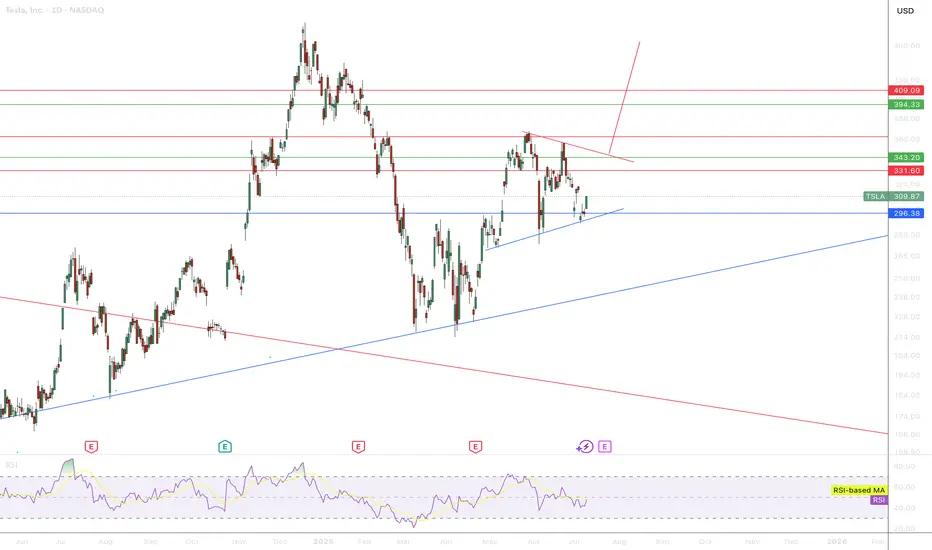
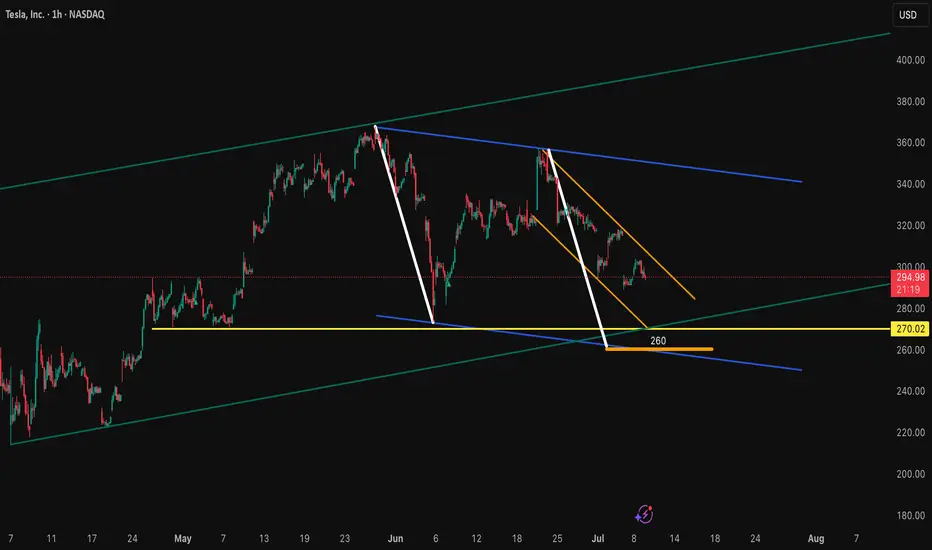
Tesla, Below 200 Next - The Crash Can Reach 140, 150 & 160Tesla has been bearish since December 2024 and producing lower highs since. A strong lower high happened late May with a shooting start candlestick pattern. A month later another lower high and bullish rejection with an inverted hammer.
This looks like an ABC correction with the low in March/April being the A wave. The lower high in May the B wave and the next low the final C wave. This would complete the corrective pattern.
Conditions for bullish
An invalidation of the bearish bias and potential would happen with a rise and close, weekly, above 355. Any trading below this number and the bearish bias remains intact.
Indicators: RSI & MACD
» RSI:
The RSI looks pretty bad as it already curved down; trending down and moving lower since December 2024.
» MACD:
The weekly MACD is weak, starting to curve but still on the bullish zone. The daily MACD already turned bearish and moving lower.
Summary
Overall, market conditions are weak for this stock and everything points lower. The chart structure points to a lower low based on a broader bearish trend.
Thank you for reading.
Namaste.
TSLA01 trade ideas

TSLA: Buy ideaBuy idea on TSLA as you can see on the chart after the breakout with force the resistance line by the buyers.

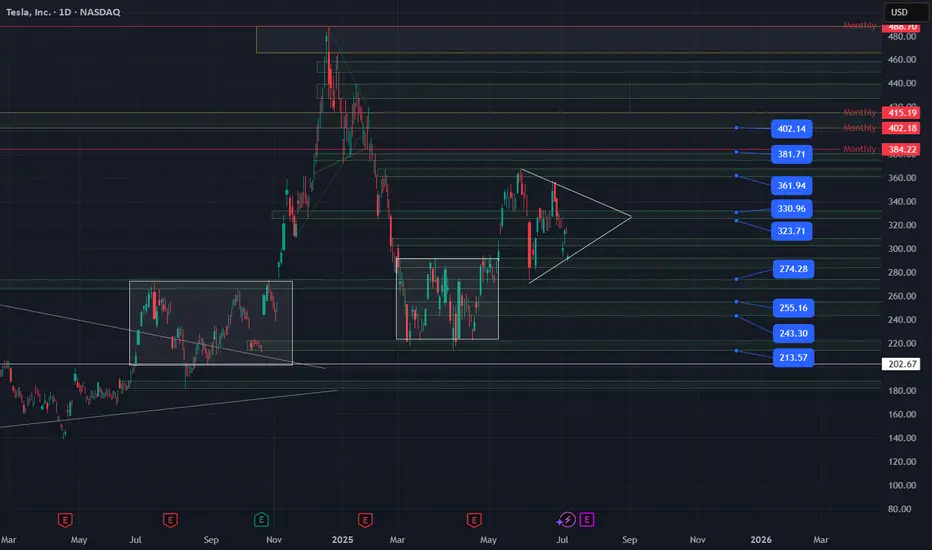
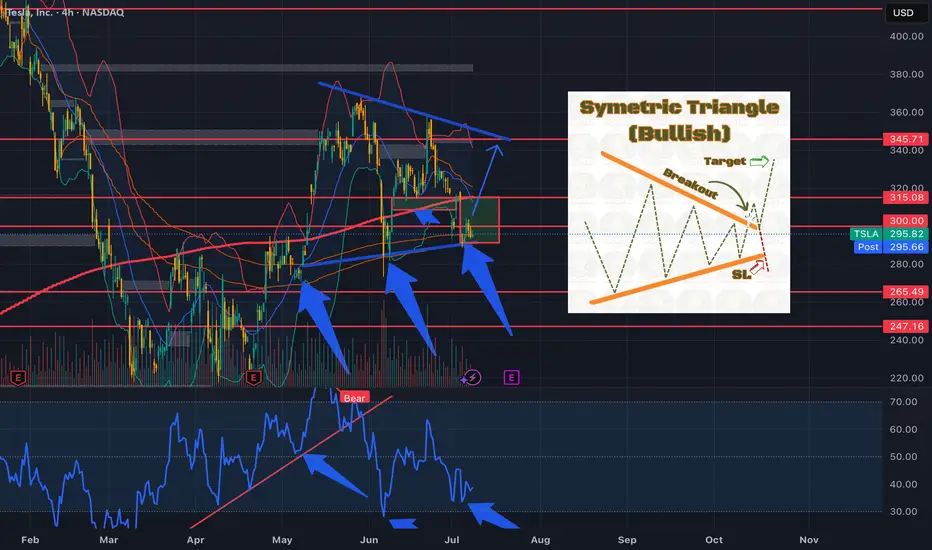
TSLA, Long, 1D✅ TSLA has just broken out of a clear symmetrical triangle pattern, signaling a potential bullish continuation.
Yesterday’s daily candle was a white Marubozu, indicating strong buying pressure and clear dominance by the bulls.
LONG 📈
✅ Like and subscribe to never miss a new technical analysis! ✅

TSLA at Critical Compression – Will 300 Break or Reject Again?🔍 Options Sentiment (GEX) Insight:
TSLA is currently sitting just below the $300 call wall — a key resistance level with 71.83% call gamma. This makes $300 a battleground where dealers are likely to defend against upward movement unless there's a significant catalyst or volume thrust. The highest positive call gamma is stacked at $320, making that the next magnet level if $300 is breached with strength.
Below, the $290 level is critical, hosting a major PUT wall and high-volume liquidity (HVL). A break below could trigger acceleration toward $285–$280, where the strongest negative NET GEX exists — signaling potential dealer hedging flows in favor of downside momentum.
Options Trade Ideas:
* Bullish Scenario (Breakout):
* Buy CALL if TSLA breaks and holds above $300, targeting the $310–$317.5 range.
* Ideal setup: Use 310c or 315c, 1–2 weeks out, looking for gamma squeeze.
* Bearish Scenario (Breakdown):
* Buy PUT if TSLA breaks and holds below $290, targeting $285 → $280.
* Ideal contracts: 280p or 285p, especially if IV remains low (IVR is at 21.3).
* Be cautious of chop inside the $290–$300 zone — it's gamma neutral.
📈 1-Hour Technical Structure:
TSLA is trading inside a descending wedge with a bullish CHoCH (Change of Character) confirming near the lower boundary of the wedge. There is a visible bullish OB (order block) between $288–$290, which acted as support in the last two sessions.
* Trendline Resistance from recent highs still caps upward movement unless $300 is reclaimed decisively.
* A strong bullish breakout above $300 could flip the structure fully bullish and initiate trend continuation toward $320.
* Failure to hold $290 could invalidate the CHoCH and confirm a BOS (Break of Structure) back to the downside.
Intraday Trade Scenarios:
* Scalp Long:
* Entry: $297.50 (if holds and reclaims above $300)
* Target: $307 / $310
* Stop: $293.94 (below last swing)
* Scalp Short:
* Entry: Break below $288.77
* Target: $285 → $280
* Stop: $293.94
Final Thoughts:
TSLA is consolidating near a major decision zone. $300 remains the trigger level for a directional move, and option flows suggest an explosive resolution if either side breaks. Stay nimble, wait for confirmation, and trade with clear invalidation in mind.
This analysis is for educational purposes only and does not constitute financial advice. Always do your own research and manage risk appropriately.

TESLA Reached The Support! Buy!
Hello,Traders!
TESLA gaped down on
Monday but the move was
Held up by a massive support
Area ending around 272$ and
As the support is strong we
Will be expecting a rebound and
A move up from the level
Buy!
Comment and subscribe to help us grow!
Check out other forecasts below too!
Disclosure: I am part of Trade Nation's Influencer program and receive a monthly fee for using their TradingView charts in my analysis.

Tesla (TSLA) Leads Declines in the Equity MarketTesla (TSLA) Leads Declines in the Equity Market
Yesterday, President Trump announced that letters had been sent to the United States’ trading partners regarding the imposition of new tariffs — for instance, a 25% tariff on goods from Japan and South Korea. This marks a return to “trade diplomacy” under the America First strategy. The tariffs are scheduled to take effect on 1 August, though the date remains subject to revision.
As we highlighted yesterday, bearish signals had begun to emerge in the US equity market. In response to the fresh wave of tariff-related headlines, the major indices moved lower. Leading the decline — and posting the worst performance among S&P 500 constituents — were shares of Tesla (TSLA). The sell-off followed news of a new initiative by Elon Musk, who now appears serious about launching a political “America Party” to challenge both the Republicans and Democrats.
Trump criticised his former ally’s move on his Truth Social platform, and investors are increasingly concerned about the potential impact on Tesla’s business. Tesla shares (TSLA) fell by more than 6.5% yesterday, accompanied by a broad bearish gap.
Technical Analysis of Tesla (TSLA) Stock Chart
On 2 July, our technical outlook for TSLA anticipated the formation of a broad contracting triangle in the near term. Yesterday’s price action appears to confirm this scenario:
→ The sharp move highlighted the lower boundary of the triangle (marked in red);
→ The $317 level — where the previously rising channel (marked in blue) was broken — acted as resistance.
It is worth noting that during yesterday’s session, TSLA did not fall further following the gap down. In other words, the bears were unable to extend the sell-off, suggesting that the stock may attempt a recovery towards the $317 level. This area could potentially act as a central axis within the developing triangle pattern.
This article represents the opinion of the Companies operating under the FXOpen brand only. It is not to be construed as an offer, solicitation, or recommendation with respect to products and services provided by the Companies operating under the FXOpen brand, nor is it to be considered financial advice.

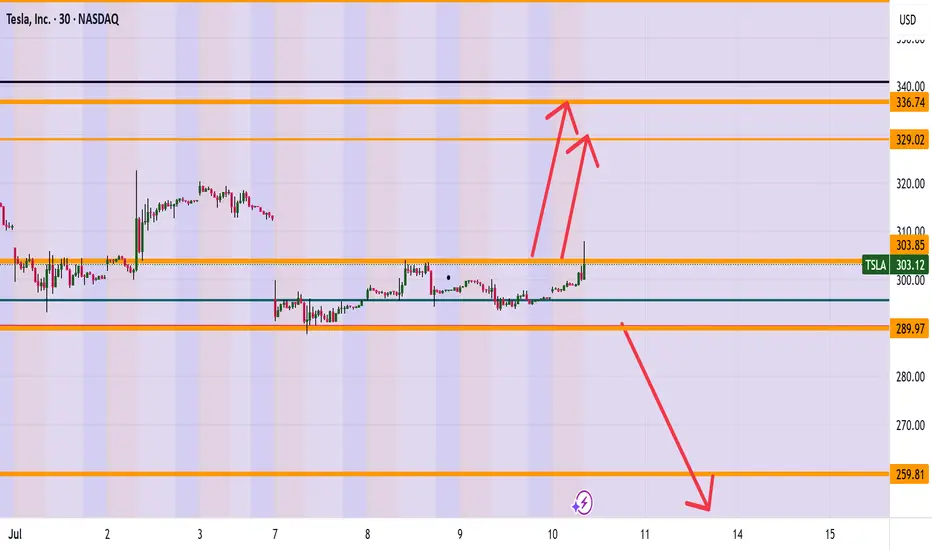
TESLA (TSLA) ARE WE HEADING TO 336? Morning Folks
It appears we are trying to break the highs of 304 and if we are successful a nice range up to 327-336 makes sense. However be careful if sink back down under 289 which then can see levels of 259 getting hit.
What are your thoughts on Tesla? Put in the comments section below
Kris Mindbloome Exchange
Trade Smarter Live Better
Long TSLA with a quick stop if we break back below 290.I have followed NASDAQ:TSLA for a while now and this 290 level has been huge. We have tried to test it a couple of times and failed, and you can see how price was stuck in a range below that level for almost 4 months earlier this year. The one thing that worries me is that there are a lot of people on social media calling for a pop here because of the drop we just saw and a lot of people are watching that 290 level. I think the market might punish the majority and dump this but the R:R is too great to ignore a trade here.
I would stop out of this if price closes back below 290 (on the 1H or D timeframe depending on your risk). If we don't stop out I would target 300, 310, 325. Break/hold above 333/5 and I would press longs for 360, 400.
If price does break/hold below 290 I would be short to target 280, 275. 275 should be another big support level as you can see the other white box/range on the chart has a top there. A look below and fail of 275 would be another good long entry and that would be the level I would watch if they decide to punish the 290 crowd.
I will post again if we see 275 otherwise look for upside with a quick stop as detailed above.
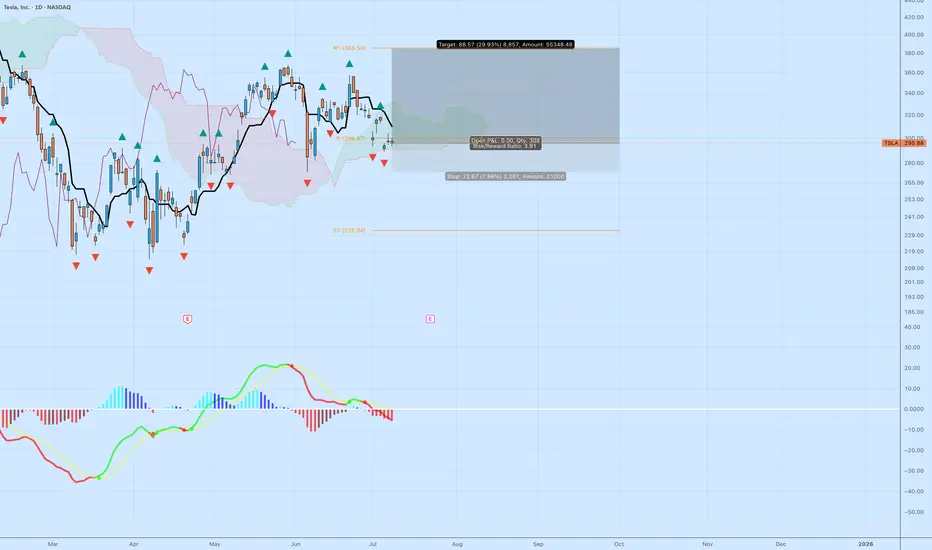
TSLA: High R/R Bounce Play Off the Cloud EdgeTesla NASDAQ:TSLA is sitting at a decision point — testing the edge of the Ichimoku cloud while momentum resets. The setup isn’t confirmed, but the risk/reward is compelling for those watching structure.
🔍 Technical Breakdown
Cloud Support: Price is holding right at the top of the cloud. A breakdown would signal trend weakness, but for now, it's a potential bounce zone.
MACD: Momentum has cooled off, but no bullish crossover yet. Early signs of a flattening histogram could suggest a pivot.
Structure: Horizontal support near $292–295 has held multiple times. If this zone holds again, the upside target opens up quickly.
🎯 Trade Specs
Entry: $296.88
Target: $385.50 (+29.93%)
Stop: $274.21 (–7.66%)
Risk/Reward: 3.91 — solid asymmetry
💡 Trading Insight:
This isn’t about calling bottoms — it’s about defining risk. When price compresses at known support, and you’ve got a 3.9 R/R profile, you don’t need to be right often to be profitable.
TSLA Caught in Tug-of-War-TA for July 10TSLA Caught in Tug-of-War: Key Gamma & Price Action Setups Unfolding ⚠️
🔍 GEX (Gamma Exposure) Analysis:
Tesla’s options market is highly polarized heading into the week.
* Gamma Walls: Strong Call Wall near $304–$310, showing potential upside magnet if bulls regain control. Above this, the $317.5–$320 zone could trigger a gamma squeeze.
* Put Walls: The $288–$285 zone represents a heavily defended downside, marked by high negative NET GEX and multiple put walls.
* Current GEX Bias: Negative gamma regime persists, increasing potential for volatile moves and sharp directionality.
* IVX is elevated at 61.1, with IVR 17.4, suggesting the options market is pricing in moderate near-term volatility.
📈 Options Trade Ideas:
* Bullish Setup: Consider July 12/July 19 300c–310c debit spread if price confirms reclaim of $300, targeting a gamma squeeze toward $317.5–$320.
* Bearish Setup: If price breaks below $288, buy 285p–275p vertical or 295p straight puts, expecting continuation toward $280 and below.
🕒 1H Price Action Outlook:
Tesla remains stuck in a tight consolidation wedge, showing a battle between supply at $300–304 and demand near $288–290.
* Structure: Market formed a bullish BOS earlier this week but failed to extend higher. The latest CHoCH + rejection from $300 zone suggests sellers are still active.
* Range: Coiling inside a triangle formation with tightening price action. A breakout or breakdown is imminent.
* Demand Zone: The green liquidity block around $284–$288 has held firm so far.
* Trendlines: Price is being compressed between a descending trendline (supply) and ascending trendline (demand), signaling a make-or-break moment.
🎯 Intraday Trade Plan:
* Bullish Case:
* Entry: Above $300 with volume
* Target: $304 → $310 → $317
* Stop: Below $294
* Bearish Case:
* Entry: Breakdown below $288
* Target: $284 → $280
* Stop: Above $295
💭 Final Thoughts:
TSLA is in a pressure cooker. A breakout above $300 opens the door to gamma-driven upside, but continued compression or a loss of $288 support could trigger a fast liquidation. Monitor volume closely — this wedge is near resolution.
This analysis is for educational purposes only and does not constitute financial advice. Always do your own research and manage risk responsibly.

Triangle Pattern in TSLALooking at 4H-1D Chart, there is a triangle pattern emerging which may target 400 area. Good luck.
Break of rising trendline TSLA – 4H 🧠
Bias: Bearish
Entry: Below 300.00
🎯 Targets: 273.67 – 253.87
❌ Invalidation: Above 315.01
Break of rising trendline signals bearish momentum. Downside continuation anticipated.
#TSLA #Stocks #NASDAQ #PriceAction #TradingView #piporia

TSLA BUY 253.8Recently, TSLA has maintained a volatile operation. Currently, we can pay attention to the area around 253.8 below, which is a potential buying position for a bullish Gartley pattern. At the same time, this position is within the previous demand area.

TSLA....Symetric Triangle....Earnings Rally?Could we see the bulls step in and leads us into earnings?
TSLA eyes on $294: Key Support for bulls to hold or face $253TSLA oscillating all over the place thanks to Musk moves.
Currently testing a key support zone $293.96-294.32.
Loss of this floor opens the Golden Genesis at $253.57
See "Related Publications" for previous charts ------------>>>>>>

TSLA · Potential Double-Top Breakdown Idea Toward $255 → $225Rounded / double-top: Two rounded peaks formed at ≈ $335-340 with a clean neckline at $295-297 (yellow arcs on my chart).
Break confirmed: Friday’s candle closed below the neckline on above-average volume, triggering the pattern.
Measured-move math: Height of the top (≈ $40) projected beneath the neckline points to $255 for a full 100 % target.
Volume-profile “void”: VPVR shows a sharp volume vacuum between $260 and $230; once below $260, price often “slides” quickly to the next demand shelf around $225-230 — my purple “1st-target” box.

TESLA 4HS Tesla broke below the triangle formation, signaling a bearish continuation.
Trend: Bearish breakdown from consolidation triangle.
Key Support (SUP): $300 (now resistance on retest).
Next Demand Zone: Strong block between $284–285.
Accumulation Zone: $250–220, identified for potential long-term institutional accumulation.
Resistance (RES): $300–350 remains a significant supply zone.
Projection Channel: Downward channel in play; price action respects descending pressure.
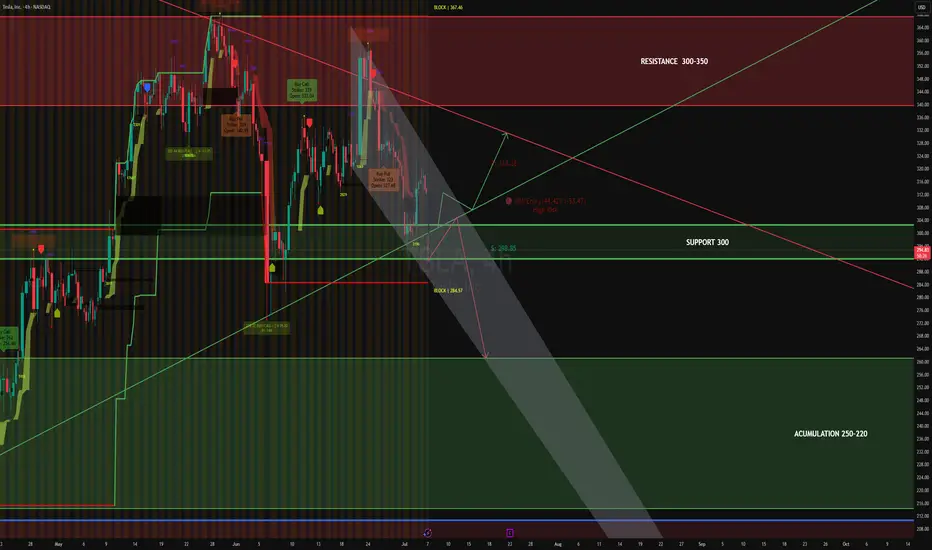
Important Volatility Period: Around August 21
Hello, traders.
If you "Follow", you can always get the latest information quickly.
Have a nice day today.
-------------------------------------
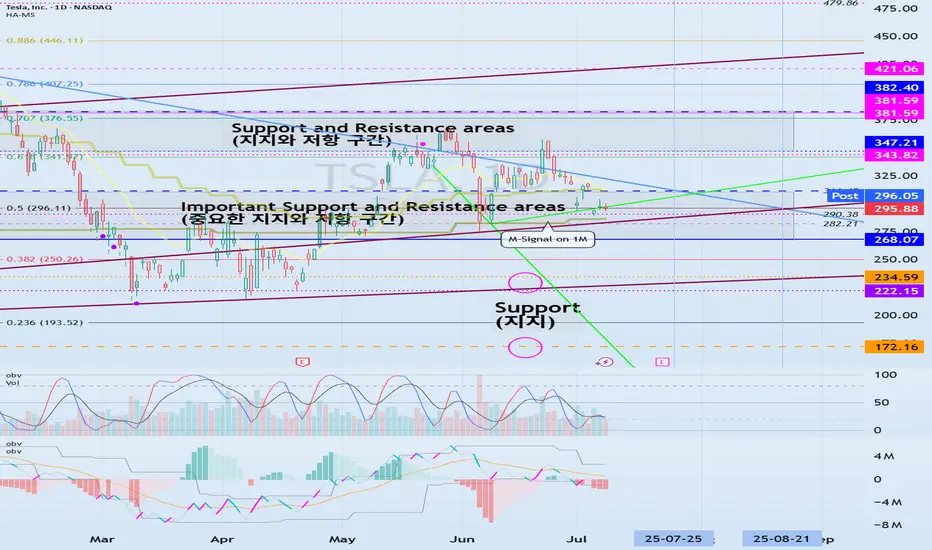
(TSLA 1D chart)
The medium-term trend is maintaining an uptrend.
However, if the price falls below the M-Signal indicator on the 1M chart and maintains, there is a possibility of a downtrend, so caution is required.
The support zone is
1st: 222.15-235.59
2nd: 172.16
Around the 1st and 2nd above.
The 268.07-311.48 zone is an important support and resistance zone.
If the price is maintained above this zone, there is a high possibility that a full-scale upward trend will continue.
However, since a resistance zone is formed in the 347.21-382.40 zone, we need to look at how this zone is broken upward.
-
When it falls to the 172.16-234.59 zone, we need to find a time to buy.
If not, we need to buy when it shows support in the 268.07-311.48 zone.
It would be better to buy at a lower price, but since the investment period will inevitably be longer, I think it is better to buy when an upward trend is detected.
-
The important volatility period is around August 21st, but before that, we need to check the movement around July 25th.
If it falls below 268.07 after August 21st, it could lead to further decline.
If it rises above 311.48 and maintains the price during the movement around July 25th, it could lead to further increase and it seems likely to create a trend after the volatility period around August 21st.
-
Thank you for reading to the end.
I hope you have a successful trade.
--------------------------------------------------
TSLA Options GEX Outlook: Bearish Pressure with Limited Support The GEX (Gamma Exposure) chart signals heavy PUT-dominant sentiment:
* Highest Negative NetGEX / PUT Support is stacked tightly around 295, with major Put Walls between 290 and 275.
* GEX clusters:
* -98.4% at $285
* -74.9% at $280
* -46% at $270
* On the upside, CALL resistance begins around 310–320, with GEX cooling off at 330.
🔍 Interpretation:
* Market makers are likely to hedge against upward price moves, increasing resistance near 310–320.
* Downside movement toward 285–280 could accelerate gamma momentum, causing a potential drop toward 270.
📉 Options Setup Suggestion:
* If price rejects at $297–300, buying PUTS (1–2 DTE) with target at 285 could benefit from GEX tailwinds.
* Avoid CALLs unless price breaks above 310 with volume.
TSLA 1-Hour Chart Technicals: Compression & Reaction Zone at Key Structure
The 1H chart shows:
* A recent Change of Character (ChoCH) and Break of Structure (BOS) near 290–295, indicating an attempt to reverse short-term bearish trend.
* Price is consolidating within a small demand zone (green box) and trying to retest the 295–297 region.
* However, TSLA remains under a macro downtrend with the descending channel intact.
🎯 Key Zones:
* Resistance: $297 → $305 → $310
* Support: $288.77 (LTF BOS) → $285 → $280
* Volume shows weak bullish momentum so far, not strong enough to push through resistance decisively.
⚠️ Trade Setup Ideas:
* PUT Scenario: If price fails to reclaim 297, consider entering near 296–297 with stop above 300. Target: 288 → 285.
* CALL Scenario (Risky): Only consider Calls above close + hold over 300, aiming for 310 with tight stop below 297.
🧠 Final Thoughts:
* Bias: Bearish to Neutral until price shows strong reclaim above 300.
* GEX setup favors PUT plays, especially on weakness below 295.
* If shorting, watch for reaction at 285 — this is the last solid gamma level before an air pocket to 270.
* Stay nimble, use stops, and respect trendline pressure overhead.
Disclaimer: This analysis is for educational purposes only and does not constitute financial advice. Always do your own research and manage your risk before trading.

TESLA: Bulls Will Push
The price of TESLA will most likely increase soon enough, due to the demand beginning to exceed supply which we can see by looking at the chart of the pair.
Disclosure: I am part of Trade Nation's Influencer program and receive a monthly fee for using their TradingView charts in my analysis.
❤️ Please, support our work with like & comment! ❤️

TSLA racing to break thru resistancearea 1: 340
area 2: 360
will be tuned into earnings to see if the jig is jiggin July 23rd.
Elon is busy. so let's see what's the dealio.
****280 is a key level
**300 needs to hold for these attempts

$TSLA: Battleground stock. There’re better way to make money. In this bull market where almost all the stocks are working, NASDAQ:TSLA seems to be still in the penalty box. When NASDAQ:NVDA , NASDAQ:MSFT are at ATH and most of the Mag7 are near to the ATH. NASDAQ:TSLA is still 33% below its ATH of 484 $. And the price action is not particularly bullish. This week NASDAQ:AVGO crossed NASDAQ:TSLA with a larger Market Cap cos. May be NASDAQ:AVGO should replace NASDAQ:TSLA in MAG7. A food for thought.
With such poor price action and the price stuck within the 0.618 and 0.382 Fib retracement levels the stock has not looked bullish recently. IN this recent market reversal all the speculative sectors like Quantum, Space stocks and Drone stocks are working, NASDAQ:TSLA is still searching for direction. In my opinion NASDAQ:TSLA has a great future with a visionary leader, but it might end up being a good company but not a good stock. With controversy surrounding the leadership it has become a battle ground stock. There are many large cap liquid stocks where the positive momentum is working. Until the stock breaks out of this consolidating pattern it’s better to make money somewhere else.
Verdict: Stay on sidelines for NASDAQ:TSLA stock. Accumulate if you need to. Buy it above 400 $ once momentum is back.