SPY & MegaCap strengthSPY saw a very strong gap up, negating most of the selling from last week.
despite rising tensions in the middle east - investors have shrugged off volatility and bought the initial dip.
This may be proving that "war" is good for stocks.
we observed a very close correlation between the indices and oil today.
As oil reversed higher - markets saw a bit of weakness. As oil fell markets rallied.
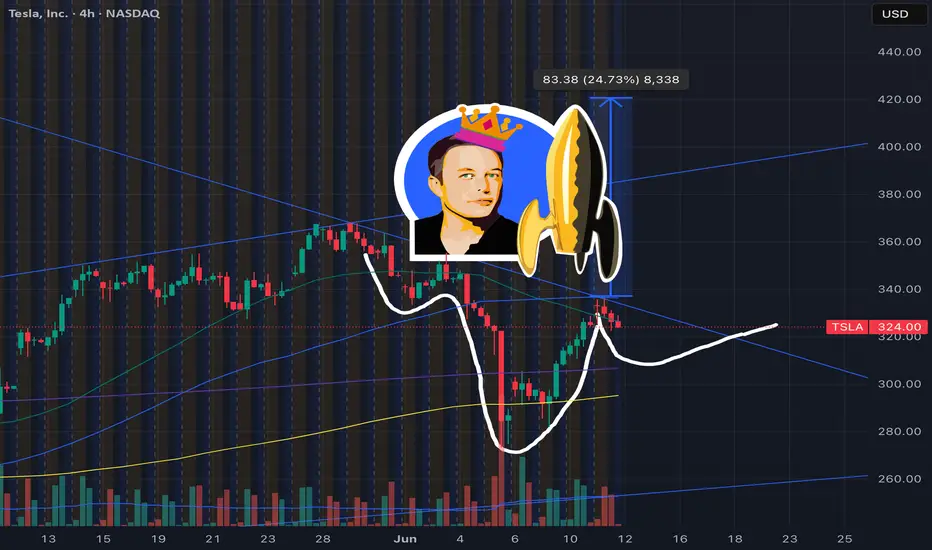
TSLA trying to break a 4 hour bullish pattern
META new Smart Glasses release causing a surge.
MSFT new all time high tap
NVDA firm with ripping semiconductors
GOOGL looking strong for continuation
AMZN moving nicely off support
AAPL lagging the mega's but positive
TSLA01 trade ideas

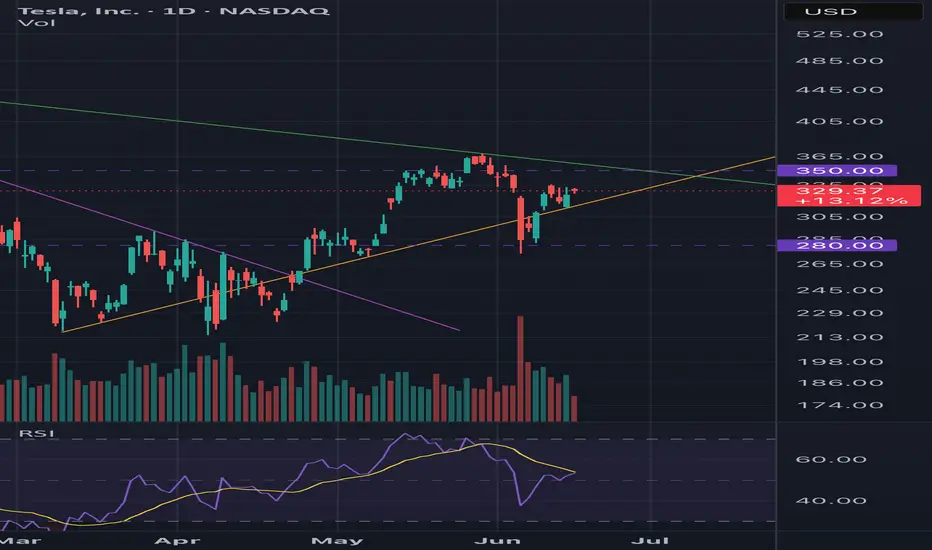
TSLA Bullish to $350I’m still bullish on TSLA. As long as it stays above the orange trend line I expect us to grind higher. RSI is not in overbought territory. $350 is the target.
Take a bullish position on TSLA as price action confirms upside
Current Price: $325.31
Direction: LONG
Targets:
- T1 = $335.00
- T2 = $345.00
Stop Levels:
- S1 = $320.00
- S2 = $315.00
**Wisdom of Professional Traders:**
This analysis synthesizes insights from thousands of professional traders and market experts, leveraging collective intelligence to identify high-probability trade setups. The wisdom of crowds principle suggests that aggregated market perspectives from experienced professionals often outperform individual forecasts, reducing cognitive biases and highlighting consensus opportunities in Tesla.
**Key Insights:**
Tesla has shown substantial resilience in the tech-heavy market, with bullish sentiment linked to its innovative product lineup, particularly autonomous vehicles and the forthcoming robo-taxi launch. Institutional investors have actively increased positions, signaling long-term confidence in Tesla’s disruptive growth narrative. However, mixed profitability metrics and emerging competition in the global EV space keep valuations under scrutiny. Tesla’s price action around $325.31 suggests that the optimism surrounding potential catalysts outweighs near-term concerns, with technical momentum favoring further upside gains.
**Recent Performance:**
Tesla has demonstrated significant strength in recent trading sessions, successfully recovering from a minor pullback that aligned with broader market volatility. The stock climbed steadily from its $300 support level and has outperformed the broader tech sector during a period of overall market uncertainty. Heavy volume and speculative trading suggest strong engagement from both institutional and retail participants.
**Expert Analysis:**
Technical outlook for Tesla indicates bullish divergence on the daily Relative Strength Index (RSI) coupled with a successful retest of its 50-day moving average. These factors affirm that momentum remains firmly to the upside. Analysts highlight Tesla’s ability to set remarkable trends within the EV sector, backed by advancing autonomous technologies and renewable energy solutions. Near-term resistance sits at $335, where a breakout would likely trigger further upward movement toward $345.
**News Impact:**
Recent news regarding Tesla’s upcoming robo-taxi launch in June has considerably bolstered investor sentiment. Market participants view this innovation as a key milestone that could redefine Tesla’s growth trajectory. However, declining EV sales in Europe and the United States remain a concern, potentially capping excessive bullish momentum. Traders should watch for more clarity on macroeconomic factors influencing demand.
**Trading Recommendation:**
Tesla’s combination of technical strength and ground-breaking product developments underpins a favorable trading outlook. A long position with well-defined stops below $320 offers an attractive risk/reward setup, targeting $335 and $345 sequentially. While global sales trends warrant close monitoring, Tesla’s leadership within the EV and tech space supports a bullish thesis in the short term.

TESLATesla is in the correction right now for bigger structure. It can go up to break the recent top with small correction or it can breakdown further before a push up.
Disclosure: We are part of Trade Nation's Influencer program and receive a monthly fee for using their TradingView charts in our analysis.

TSLA: Gamma & Price Action Aligning for Potential Bullish-Jun 16TSLA: Gamma Setups & Price Action Aligning for Potential Bullish Run
1️⃣ Options GEX Insights
* Gamma ‘walls’ building: Strongest Call protection at 335–350, anchored by the largest NETGEX/Call Wall — signaling substantial gamma support in that zone.
* Current call exposure stands at 76.1%, with puts at 23.9%. With IV suppressed (28.2 vs 78.6 avg), volatility is compressed—ideal for a quick rebound if triggered.
* Price is near 325, resting above the 317.5 HVL, and poised to test the gamma shelf near 335–340. Entry into 0–5DTE or 3DTE calls around 325–330 offers leverage as gamma accelerates through these walls.
2️⃣ 15-Minute Chart & Trade Plan
* Structure: Broke down below ascending range, but just executed a bullish Break of Structure (BOS) reversal near 309–310.
* Current trend: Eyes stacked higher lows (HL), structure confirmed—momentum is rebuilding.
* Key Zones:
* Entry area: on pullback/support near 325–326
* Target: 332.99–335+ (aligned with Call Wall)
* Invalidation: below 319.11, which would signal loss of structure.
⏫ Trade Suggestion: Consider initiating a bull entry on dip into 325–326, targeting 332–335 for the short term, and scaling out or trailing into gamma resistance zones.
🧠 Why I’m Interested
The alignment here is compelling: Options flow shows strong net gamma support ahead, IV is low (less decay hit), and structure reset (HL + BOS) confirms a textbook SMC setup. TSLA is carving out a classic bull signal off gamma-based support—ideal for scalping or short-term leg trades.
🚨 Disclaimer
This is not financial advice—purely educational. Trade with proper risk management, and be aware options carry unique risks, including rapid theta decay and volatility shifts.

TSLA June 2025 Monthly Support & Resistance Lines Valid till EOMOverview:
The purple lines serve as support and resistance levels for TSLA stock throughout the month of June. When the price approaches these lines from either the bottom or the top, I will consider taking long or short positions in TSLA stock, depending on the direction of the price movement.
Trading Timeframes
I usually use 30min candlesticks to swing trade options by holding 2-3 days max. Some can also use 3hr or 4hrs to do 2 weeks max swing trades for massive up or down movements.
I post these 1st week of every month and they are valid till the end of the month.
Extra:
I added Blue Lines which are weekly line for June 16th to 20th.

TESLA WILL GO DOWN|SHORT|
✅TESLA is going up now
But a strong resistance level is ahead at 336$
Thus I am expecting a pullback
And a move down towards the target of 320$
SHORT🔥
✅Like and subscribe to never miss a new idea!✅
Disclosure: I am part of Trade Nation's Influencer program and receive a monthly fee for using their TradingView charts in my analysis.

looking hella bullishThe price will likely shoot up during premarket, then capitualate, then have the real price movement when the market opens.
Price is getting squeezed tighter, likely will have a dramatic move.

TSLA UPSIDE? BULLISH?Thoughts on Elliott Wave pattern applied to TSLA DAILY chart. Please do share thoughts, my belief is were are in a primary third wave, expect 5 impulse waves of minuet up. Hearing good things from tesla again recently.

Near bottom. On The way To $2k as The Singularity Approaches see chart.
Near bottom. On The way To $2k as The Singularity Approaches .

Gold silver the es and the Russell Friday 13 there's no time to have a long discussion here the information is in the video important things are happening in these markets and they are explained in the video. there are some changes suggesting that the silver may not actually go lower at this point even though the gold is holding for the time being .

How I Got My Win Rate to 94.12% ($4.59 per $1 risk expectancy)There's a lot of people who talk smack about high win rates, probably to justify their low win rates.
The justification usually sounds something like this 'You do know the best traders have win rates under 50% and win rates mean nothing right?'. Nothing could be further from the truth in the context of the archetypal character who writes such a thing in trading view minds. A high win rate shows something very very important.. proof of edge.
Now if someone wants to believe I'm taking penny wins and dollar losses, be my guest but use your head...in fact, one better... use your eyes. There is a nice little stat there called 'profit factor', what it tells you is how many dollars profit per trade my expectancy is. Wake up, understand that not everyone is a trading guru scammer. Not everyones stats are fake, and if you want to see for yourself... its easy to do. Simply watch my livestream, there is no better proof of edge than that.

TESLA Will Fall! Sell!
Hello,Traders!
TESLA went up from the
Horizontal support but has
Hit a horizontal resistance
Of 335$ and we are already
Seeing a bearish pullback
So we will be expecting
A further local move down today
Sell!
Comment and subscribe to help us grow!
Check out other forecasts below too!
Disclosure: I am part of Trade Nation's Influencer program and receive a monthly fee for using their TradingView charts in my analysis.

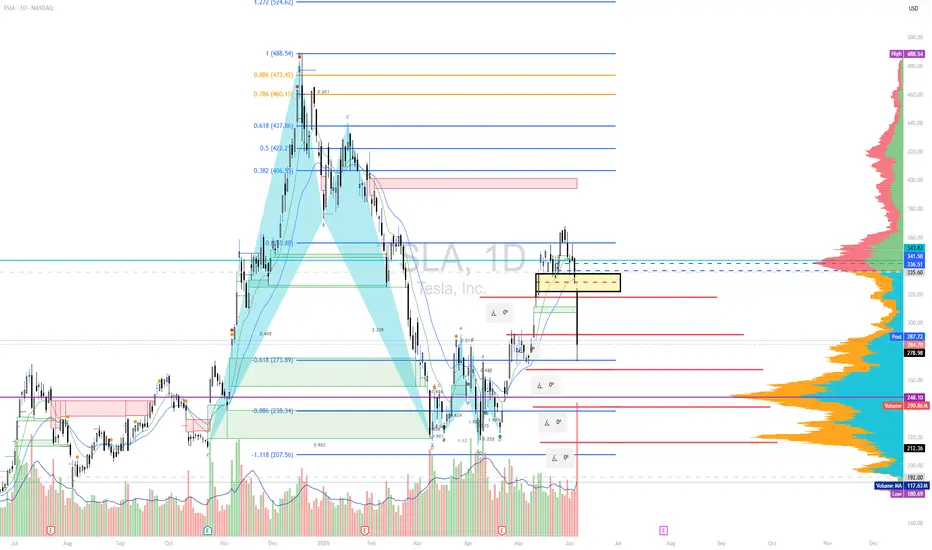
Tesla’s Flat Deception: Bearish Wave Y in the Making?Tesla’s price structure has taken traders on quite a journey, and after peeling back the layers, it's clear that both bullish and bearish possibilities demanded attention — but only one holds more weight for now.
The first sign of life came at the March low, where price made a lower low (218.13 to 214.25), but RSI formed a higher low. This classic bullish divergence paved the way for a strong rally, confirming that Wave W had likely ended with a sharp zigzag, and Wave X was beginning to unfold. The bounce from 214.25 extended into a flat structure, which completed near 367.71 — a textbook ABC flat with the internal wave b forming a higher low at 223.17.
Initially, this structure looked like the beginning of a bullish impulse. The drop to 273.22 perfectly tagged the 0.618 Fibonacci retracement, and it was tempting to label it as Wave 2 of a new impulse. However, that bullish view began to crack when the bounce from 273.22 appeared to be a three-wave move, not a clean five-wave impulse. More importantly, Wave 4 of this move overlapped the price of Wave 1 — a key violation that rules out a typical impulse and instead suggests the move was a leading diagonal.
This view is supported by the RSI, which revealed bearish divergence as price climbed from 350.00 to 367.71 — price made a higher high, but RSI made a lower high, indicating fading momentum. That divergence, combined with the overlapping structure, tilts the probability toward a bearish scenario now unfolding as Wave Y.
If this view plays out, the decline from 367.71 may be the start of Wave a of Y in a final zigzag correction. The projected path would take Tesla lower in a 5-3-5 structure, with potential support near or below the March lows. The bearish view remains valid as long as price stays below 367.71 — the clear invalidation point. A move above that level would force a reevaluation and potentially revive the bullish case.
At this point, the market has spoken — and it's whispering bearish. The structure favors caution unless bulls reclaim momentum with strength.
Disclaimer: This analysis is for educational purposes only and does not constitute investment advice. Please do your own research (DYOR) before making any trading decisions.

Tesla (TSLA) Share AnalysisHello, Tesla investors!
Tesla stock has gained good momentum recently, breaking the downtrend and rising to $362. This rise has been fueled by investor interest in Elon Musk's full-time return to the company's helm and the upcoming Robotaxi launch.
Technically speaking , the stock has formed a "double bottom" (W) pattern, and its target, $362, has been reached. However, we are now facing strong resistance at this level. If this resistance level is not surpassed with sufficient trading volume, we may see a short-term pullback.
The possibility of a short-term correction increases, especially with the RSI indicator approaching the overbought zone.
The $335 and $290 regions stand out as support levels. These levels are important to watch for possible pullbacks.
In summary , Tesla stock is in an important resistance zone. Breaking through this level with high volume could signal the start of a new uptrend. Otherwise, we may face a short-term correction. Consider these levels and technical indicators when making investment decisions.

Quick View: $TSLADaily -> Bullish crossover with pullback (and volume)
Hourly-> Consolidated bullish trend
Watching for a #TopSwing Setup on the Daily Chart

Short TSLA, for nowdef juice to the downside right now, media attn is insane. But theirs major harmonics at play. and ill be buying at those lows and posting long, until then. dont fight it. t3 almost hit of momentum measure. actually insane moves
TSLA This is good. 329 over and 335 is next resistance. Really good trade if for tomorrow for next week. Given the stock can hold here

TSLA Short Entry | Recession UnderwayI have added to NASDAQ:TSLA short.
I have also linked my previous Tesla short chart from 2022.
Nothing has changed with Tesla. The company is severely over-valued.
I will continue to provide updates.

Tesla TSLA 🧠 Breakdown of this setup:
The pattern is an inverse head‑and‑shoulders, signaling a reversal from bearish to bullish momentum.
Technical commentators highlight crucial support near $300, suggesting that’s the fueling station before lift-off
After breaking the neckline, measured upside targets land in the $400–420 zone, fitting that “rocketship” trajectory vibe
🎯 Launch Pad & Destination
Pre‑launch dip: ~$300 sets the inverse H&S bottom.
Ignition point: Breakout above neckline brings liftoff.
Orbit target: ~$420—your mission succesfully completed.
Wednesday Session Debrief (100% Win Rate This Week Thus Far).Early move 1 put @ 935am entry was stacked against a large Bullish FVG so I didn't take it. Call structure came in, but ended up being false positive. As a result i opened a short hedge (01), got chopped up and opened another long and 3 more shorts during 1 hour of choppy price movements as bulls and bears fought over direction to establish control. The final short i opened was when price pushed below $330, exited in very decent profit today considering the unpredictable price action.

Cup and handleA big move is coming if the formation breaks to the upside. I see 500-520$ as the target area.

TESLA - Multiyear ChartI'm optimistic about Tesla's long-term prospects, viewing it as a multi-year investment. I anticipate Tesla reaching new highs this year, followed by a 50% correction from the peak to retest the breakout level. With patience, holding for years could yield strong returns.
