Idea for SGDCHF Strong support for SGDCHF. SL possible at 0.700554 with TP at 0.71194, 0.7200 or 0.72930.
This is my first post so pls give me some tips on how to improve and if I am doing this right or wrong
SGDCHF trade ideas


Going longCHfSGD Has shown us a big Long on the Daily chart the next step is for investors to wait on the next retracement before going for a buy order

#CHFSGD [D1C] A Promising LONG setup.SAXO:CHFSGD
Awaiting more downside to go long from indicated price on chart.
This pair is kind of wild so a might shoot down sooner or later and retrace up again to marked ranges.
Follow for more similar setups...
#AHMEDMESBAH


Don't miss the great sell opportunity in CHFSGDTrading suggestion:
. There is still a possibility of temporary retracement to suggested resistance line (1.3835). if so, traders can set orders based on Price Action and expect to reach short-term targets.
Technical analysis:
. CHFSGD is in a range bound and the beginning of downtrend is expected.
. The price is above the 21-Day WEMA which acts as a dynamic support.
. The RSI is at 50.
Take Profits:
TP1= @ 1.3755
TP2= @ 1.3695
TP3= @ 1.3600
SL: Break Above R2

CHF SGD, LONGbased on the price movement, the price shows a trend continuation upward, so based on my analysis go long according to the chart I published.

SGD/CHF signalling to go downCHF is getting stronger and we might see levels as below as 0.703.
Entry: 0.7275
Stop: 0.733
First target: 0.711
Second target: 0.703.
Have a good weekend. Follow to hear more.


Rising wedge forms on SGDCHFA rising wedge requires at least 3 touches for it to be valid. The prices are making higher highs and higher lows. A rising wedge is considered a terminal pattern and hence the bullish momentum must eventually come to an end. SMA 50 is below SMA 200 and the breakout candle has closed below SMA 200. Since SMA 50 is below SMA 200, it implies that the long term bias is still bearish. Stop-loss is placed at the last swing high. We have three take profit levels and they are the respective swing lows and are potential areas of support.

CHFSGD time for bullish?CHFSGD bearish may ended here so we can buy this pair and hold for about 3months, goodluck


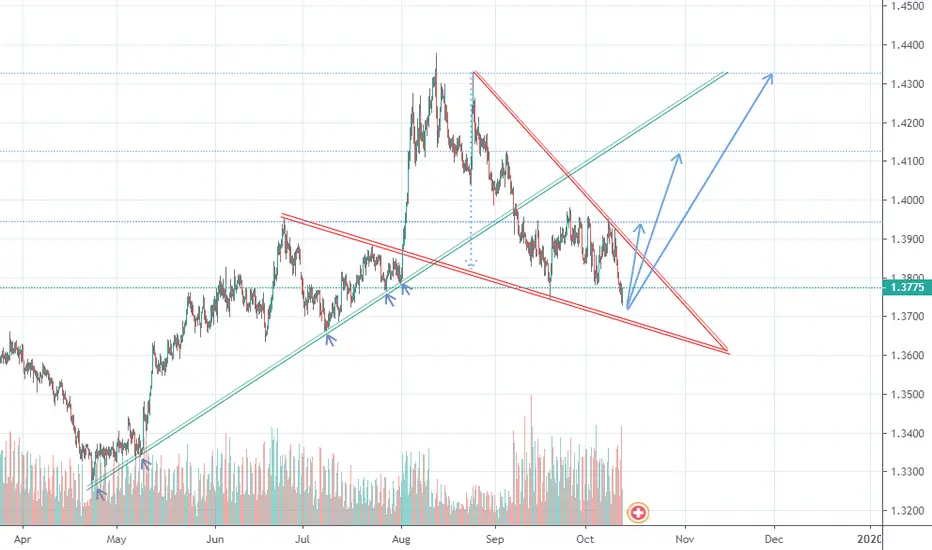
CHFSGD: Sell opportunity on the next top.The pair has been trading within a 1D Channel Down (RSI = 42.510, MACD = -0.005, Highs/Lows = -0.0006) since the August High. On a wider time frame the current price action appears to be replicating the October-November 2019 period when a similar Channel Down made a temporary bottom on the 1D scale, spiked to a Lower High before making the May bottom.
With the 1D RSI forming a similar sequence as well, we are expecting a similar pattern. The next rise towards the 1D MA50 (blue line) is a sell opportunity for us with 1.34200 - 1.33500 the Target Zone.
** If you like our free content follow our profile (www.tradingview.com) to get more daily ideas. **
Comments and likes are greatly appreciated.

Reversal at Cam S3Reversal both at weekly and monthly Camarilla S3.
Wyckoff bullish accumulation pattern.
Bullish engulfing on daily (forming).
Bullish pinbar on weekly (forming).
RSI turned from oversold on 4 hrs.