USDSGD Time for bullish continuations
Hi traders:
Liking the price action on USDSGD to have a bullish continuation move.
We see price has formed a correction with a double bottom reversal price action.
LTF had a sharp impulse up, breaking out of the HTF correction.
We then see a LTF continuation correction in the making, and price is breaking out now.
Look for buy entries up to the next swing highs.
Thank you
SGDUSD trade ideas


USDSGD - LongDaily impulse higher, now we are seeing bullish pennant corrective pattern being broken higher
I expect a run up to previous highs if the USD keeps its strength

USDSGD IdeaOn the daily TF, we can see price being consolidated between strong areas: Middle BB and 150 EMA. We also see a descending triangle pattern and let's see which side price breakouts to.
Entry: price action bar in lower TF (1H / 4H).
It price breaks above, then we will likely be trailing the trade as trend has reversed.
If price breaks below, take profit target at Bottom BB.


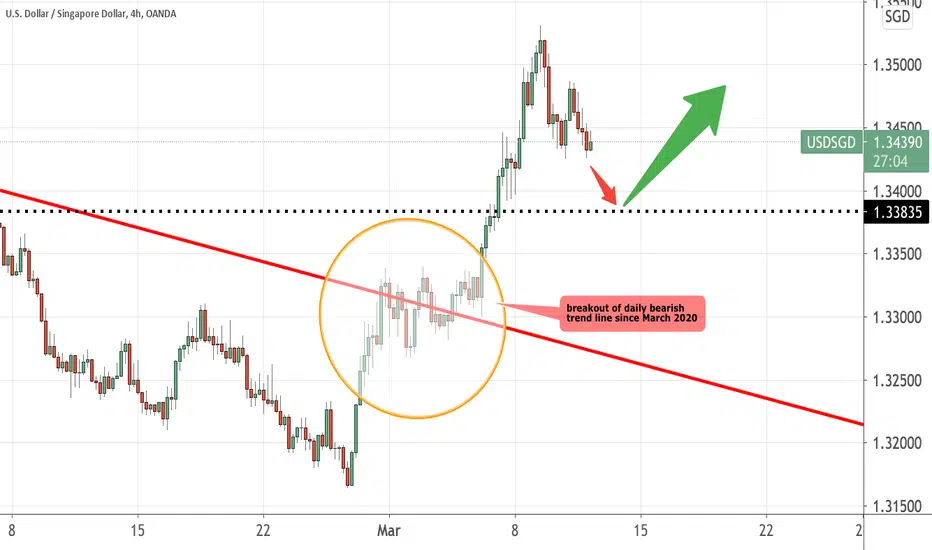
Revisiting USDSGD after 12 months had passed.....In March 2020, we witnessed the peak of USDSGD at 1.464 price level and following , it went into the dark zone , battling 12 months of continuous selling until 4 March 2021 where it managed to see light at the end of the tunnel.
Now, we would like to see the price correct itself to 1.338 before we take a long position.
Of course, we congratulate the shortists who made good profits out of this 12 months of shorting !
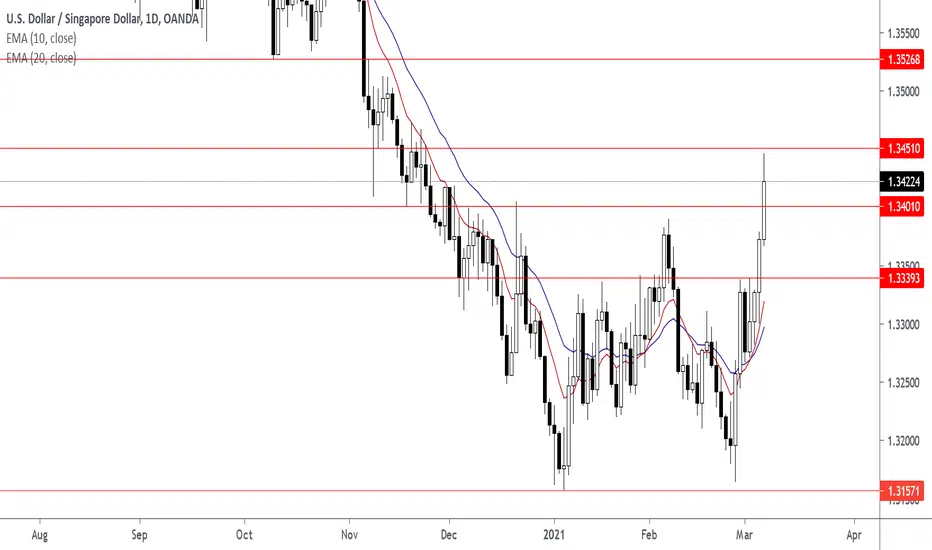
USD/SGD (The further UPside ahead?)View On USD/SGD (15 MAR 2021)
USD price has been rising in the recent months and I see 1.336 as a good support.
As long as 1.336 region hold well, I expect it go go to 1.358 and may even go to 1.37 region.
DYODD, all the best and read the disclaimer too.
Feel Free to "Follow", press "LIKE" "Comment".
Thank You!
Legal Risk Disclosure:
Trading foreign exchange or CFD on margin carries a high level of risk, and may not be suitable for all investors.
The high degree of leverage can work against you as well as for you. Before deciding to trade foreign exchange you should carefully consider your investment objectives, level of experience and risk appetite.
The possibility exists that you could sustain a loss of some or all of your initial investment and therefore you should not invest money that you cannot afford to lose.
You should be aware of all the risks associated with foreign exchange trading, and seek advice from an independent financial advisor.
DISCLAIMER:
Any opinions, news, research, analyses, prices or other information discussed in this presentation or linked to from this presentation are provided as general market commentary and do not constitute investment advice.
Sonicr Mastery Team does not accept liability for any loss or damage, including without limitation to, any loss of profit, which may arise directly or indirectly from use of or reliance on such information.

USDSGD: Strong Bullish Signal Since Last JuneFrom the weekly chart, the key level has been conquered. That means a lot for bullish buyers.
On the daily chart, price closed above all 3 MAs. That's the first time since last June
What's next?
Consolidation is expected, and price may seek support to the lower control low zone before going up again. USDSGD is likely to go back to the normal range of 1.37-1.39.

USD/SGD Bullish continuation signalHi Traders
USD/SGD (H4 Timeframe)
A high probability, entry to go LONG is forming @ 1.34787 after the market found support @ 1.34100. Only the downward break of 1.34100 would cancel this bullish scenario.
Trade details:
Entry: 1.34787
Stop loss: 1.34100
Take profit 1: 1.35855
Take profit 2: 1.36947
Take profit 3: 1.38727
Score: 10
Strategy: Bullish Wave - We2

USDSGD-Expecting a leading diagonal for wave A) to 1.36Dear friends,
Don't follow me blindly...what i am sharing here, is my knowledge not signals
I am sharing my view through Elliott waves from past 4 yrs....i learned tons and tons here and market taught me lot and still teaching and i am listening to the market...and i am getting a lot of PM's regarding NEGATIVE COMMENTS from my friends...i am sharing here my view for a educational purpose and i am still a learner and i am sharing not my only my view and my experience if u PURELY LISTENNED to my MARKET COMMENTARY... i am not a market mover...just i am keep changing my view according to the PRICE ACTION and i written detailly about that in market commentary...there is no short cut to earn money and cant make a fast cash...if u do that also it may go like that....
My ambition is to create an awareness to the traders, to promote the education not to do BLINDLY...If u look my past 4 yrs chart and now...i fine tuned or refined my strategy...and still looking for finetune...so if u r following my trade plans as a signal its not my fault...If you are not encouraging also not mind but dont discourage...if you are not comment also dont leave the negative comments, if you are not motivate also dont demotivate...because NAGATIVE is more powerful than POSITIVE...i wont care about such comments...because of your comments i wont stop anything in MY PRACTICE...it will take time and to digest such comments for first 2-3 days and again i rebuilt my positive activity and my view and then again i keep start my sharing...i dont need a roadblocks in my journey. If it happen also i need to cross that and i continue...but that crossing time is DELAY for my journey to reach my GOAL...so try to be a friend...just learn or leave .if you didnt like a page in your story book just turn that... Don't look that, Like that dont look my chart...just skip that...thanks lot ...here some quotes by BRUCE LEE...
1. I fear not the man who has practiced 10,000 kicks once, but i fear the man who has practiced one kick 10,000 times "
2. A GOAL is not always meant to be reached, it often serves simply as something to AIM at
3. Those who are UNAWARE they are walking in darkness will never seek the light
4. To hell with circumstances i create the opportunities
5. I don't teach you anything. I just help you to know yourself
6. Always be yourself, express yourself, have a faith in yourself, do not go out and look for a successful personality and duplicate it.
7. Don't fear failure... in great attempts it is glorious even to fail
8. Absorb what is useful, reject what is useless, add what is specifically your own
9. Notice that stiffest tree is most easily cracked, while the bamboo or willow survives by bending with the wind
10. The successful warrior is the average man with laser-like FOUCS -
Market Commentary:
LEARNING ELLIOTT WAVES IS LITTLE BIT TOUGH (FOR ME IN BEGINNING) BUT I TOOK IT AS A CHALLENGE AND THAT IS NOT IMPOSSIBLE ALSO...
First have an look for the positional trend i shared here previous....if you are a follower of me...and sometimes i will share the counter trend trade also in 15 mins and 1hr...but that is risky ones...so if the trend is bearish or bullish, if i am expecting the correction...book the profit there and wait the correction to end and again go with the trend....DONT TRADE THE COUNTER TRADE SETUP...you will took loss too...try to identify the short term pull back and the long term pull back after that took small lots in the short term PB with strict stop and go with big lots in the trend side that is long term. I WONT TOOK ALL THE TRADE PLAN SHARED HERE...
Read the market commentary inside the chart what i shared here carefully and try to learn Elliott waves...otherwise its tough to understand the market commentary and my analysis. I wont give a entry, stop loss and take profit in my chart...it is only for EDUCATIONAL PURPOSE and i am sharing how i am analyzing the pair and labeling them according to the Elliott wave theory...I AM JUST SHOWING THE TREND HOW IT MAY GO AND MY VIEW(it may wrong too)..so DON'T FOLLOW BLINDLY MY CHART..take this as a reference and if it correlate to you strategy took the trade as per your strategy...DON'T ASK ABOUT YOUR RUNNING TRADES i wont comment on them and I WONT SUGGEST TO TAKE MY TRADE SETUP.
I am a technical analyst based on trendline, channel, fib retracements, expansion, stochastic for divergence, EMA's and MA's are finding the pull backs and MAJOR IS ELLIOTT WAVES...those mentioned above are using as a TOOLS only. I am not a fundamental, sentimental trader...but only the fundamental will boost my technical analysis to reach my target or sometimes it will go against me and then i will manage the trade according to the Elliott waves alternate views...Each and every trade plan i am sharing here has a alternate view and i am sharing only the most probabilities(70-80%) here...sometimes the other (20-30%) may market do..then i will change the wave counts and labeling according to the price action.
All labeling and wave counts done by me by manually and i will keep change according to the LIVE MARKET PRICE ACTION. So dont bias, hope on my trade plans...try to learn and make your own strategy...Following is not that much easy...I AM NOT RESPONSIBLE FOR ANY LOSSES IF U TOOK THE TRADE ACCORDING TO MY TRADE PLANS....THANKS LOT..CHEERS

It's a great buy opportunity in USDSGDTrading suggestion:
. There is a possibility of temporary retracement to suggested support line (1.3335). if so, traders can set orders based on Price Action and expect to reach short-term targets.
Technical analysis:
. USDSGD is in a range bound and the beginning of uptrend is expected.
.The price is above the 21-Day WEMA which acts as a dynamic support.
. The RSI is at 75.
Take Profits:
TP1= @ 1.3470
TP2= @ 1.3525
TP3= @ 1.3555
TP4= @ 1.3615
TP5= @ 1.3705
SL= Break below S2
❤️ If you find this helpful and want more FREE forecasts in TradingView
. . . . . Please show your support back,
. . . . . . . . Hit the 👍 LIKE button,
. . . . . . . . . . . Drop some feedback below in the comment!
❤️ Your Support is very much 🙏 appreciated! ❤️
💎 Want us to help you become a better Forex trader ?
Now, It's your turn !
Be sure to leave a comment let us know how do you see this opportunity and forecast.
Trade well, ❤️
ForecastCity English Support Team ❤️

USDSGD: Bulls Will Push Higher
Here is our today's forecast for USDSGD.
Our analysis is based on fundamental & technical metrics.
According to our drawing USDSGD is trading within a support.
Based on our view the market will start growing
to the underlined resistance.
Like & Comment Our Analysis, Please!

USDSGD on a triangle 🦐USDSGD on the 4 h chart broke the descending channel and now consolidating below a daily resistance in an ascending triangle formation.
IF the price will break above, according to Plancton's strategy, we can set a nice long order.
–––––
Follow the Shrimp 🦐
Keep in mind.
🟣 Purple structure -> Monthly structure.
🔴 Red structure -> Weekly structure.
🔵 Blue structure -> Daily structure.
🟡 Yellow structure -> 4h structure.
⚫️ Black structure -> >4h structure.
Here is the Plancton0618 technical analysis , please comment below if you have any question.
The ENTRY in the market will be taken only if the condition of the Plancton0618 strategy will trig


Price Action Personal AnalysisPersonal analysis Please deal with your analysis and also comment Thank you

USDSGD SHORT TRADEI am looking for USD weakness. This pair is rejecting resistance and formed a double top with a bearish pin bar formed on the 4 hour chart at current resistance. I am targeting previous support.
USDSGD daily engulfingNot the greatest ratio but engulfing's of a key level are hard to ignore.
Target would be around 1.3379 level

BEARISH CALL this is my bearish trend idea. how ever wait for clear trend continue moment and wait for trend continue after can entry .this is my opinion not for any signal service .good luck.

