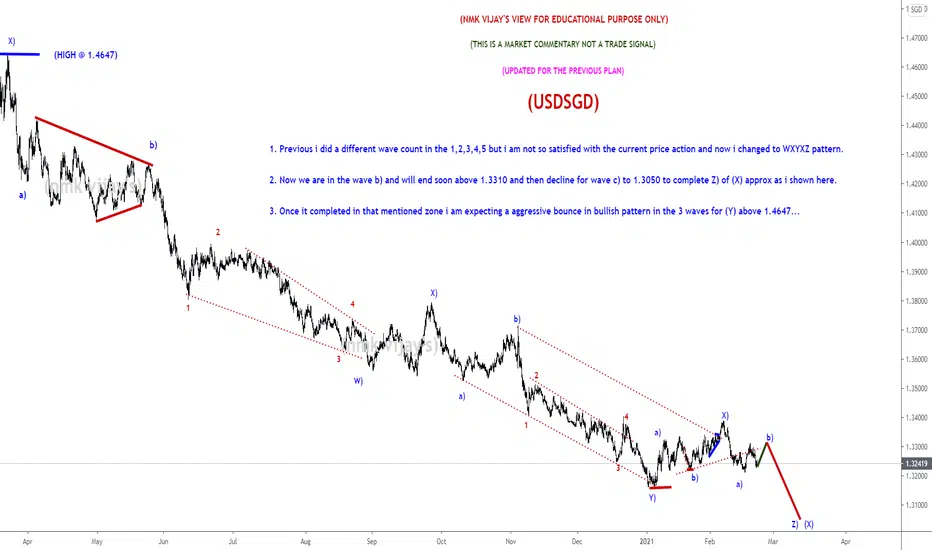
USDSGD-Expecting C) of Z) to 1.3050 and then BULLISH ?Market Commentary:
LEARNING ELLIOTT WAVES IS LITTLE BIT TOUGH (FOR ME IN BEGINNING) BUT I TOOK IT AS A CHALLENGE AND THAT IS NOT IMPOSSIBLE ALSO...
First have an look for the positional trend i shared here previous....if you are a follower of me...and sometimes i will share the counter trend trade also in 15 mins and 1hr...but that is risky ones...so if the trend is bearish or bullish, if i am expecting the correction...book the profit there and wait the correction to end and again go with the trend....DONT TRADE THE COUNTER TRADE SETUP...you will took loss too...try to identify the short term pull back and the long term pull back after that took small lots in the short term PB with strict stop and go with big lots in the trend side that is long term. I WONT TOOK ALL THE TRADE PLAN SHARED HERE...
Read the market commentary inside the chart what i shared here carefully and try to learn Elliott waves...otherwise its tough to understand the market commentary and my analysis. I wont give a entry, stop loss and take profit in my chart...it is only for EDUCATIONAL PURPOSE and i am sharing how i am analyzing the pair and labeling them according to the Elliott wave theory...I AM JUST SHOWING THE TREND HOW IT MAY GO AND MY VIEW(it may wrong too)..so DON'T FOLLOW BLINDLY MY CHART..take this as a reference and if it correlate to you strategy took the trade as per your strategy...DON'T ASK ABOUT YOUR RUNNING TRADES i wont comment on them and I WONT SUGGEST TO TAKE MY TRADE SETUP.
I am a technical analyst based on trendline, channel, fib retracements, expansion, stochastic for divergence, EMA's and MA's are finding the pull backs and MAJOR IS ELLIOTT WAVES...those mentioned above are using as a TOOLS only. I am not a fundamental, sentimental trader...but only the fundamental will boost my technical analysis to reach my target or sometimes it will go against me and then i will manage the trade according to the Elliott waves alternate views...Each and every trade plan i am sharing here has a alternate view and i am sharing only the most probabilities(70-80%) here...sometimes the other (20-30%) may market do..then i will change the wave counts and labeling according to the price action.
All labeling and wave counts done by me by manually and i will keep change according to the LIVE MARKET PRICE ACTION. So dont bias, hope on my trade plans...try to learn and make your own strategy...Following is not that much easy...I AM NOT RESPONSIBLE FOR ANY LOSSES IF U TOOK THE TRADE ACCORDING TO MY TRADE PLANS....THANKS LOT..CHEERS
SGDUSD trade ideas

USDSGD price movement I expected like usdsgd mine own perspective so what's your consideration on the price movement please comment in the below section ?
I believe that. So what is your expectations in comment below.
So guys Let's look at it 😍😍😍🥰😍😍😍😍 with #hasanat_hussain_al_ahmed_hasan
Learn forex then thought to does earn
Stay With me
Stay With trading

USDSGD - Buy Entry - D1 Daily ChartUSDSGD - Buy Entry - D1 Daily Chart
Buy @ Once a Higher Low is confirmed - Wait for pull back
USDSGD mS1-Y1 @ 1.3206
Stop Loss @ 0.5% to 1% of your Account Balance
Take Profit @ A long term trade, as a turn on the Daily, and Weekly charts
Take Profit @ I will update when to close - Follow me to receive updates ✅
Please support the idea with a Like 👍
Follow me to receive updates of this analysis, plus new ideas ✅
Thank you for your support 😊
Wishing you successful trading 🙏
------------------------------------------------------------------------------------
🔺 DISCLAIMER
🔺 The content of this analysis is subject to change at any time without notice.
🔺 It is provided for the sole purpose of assisting traders to make independent investment decisions.
🔺 You must do your own research to create your own trading plan for the market.
------------------------------------------------------------------------------------

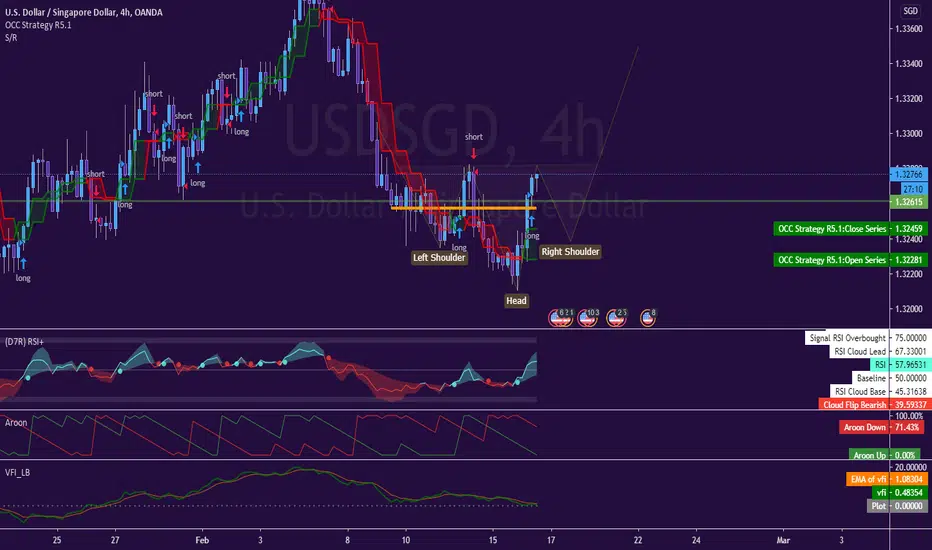
View on USD/SGD (3/2)Price is in a no man land.
higher high has been created.
expecting price to head up higher
looking to short around 1.338 zone.
Disclaimer:
The information contained in this presentation is solely for educational purposes and does not constitute investment advice. We may or We may not take the trade.
The risk of trading in securities markets can be substantial. You should carefully consider if engaging in such activity is suitable to your own financial situation.
I am not responsible for any liabilities arising from the result of your market involvement or individual trade activity

USDSGD Short During 2020 the Singapore dollar strengthened against the US dollar from 1.3453 to 1.3211.
According to economists at MUFG Bank, neutral SGD NEER policy is likely to be maintained which should dampen Singapore dollar gains.
we can see short trade progressing towards the downside, baring the weakness of the USD continues.
This neutral policy will set the tone for USD/SGD trading for the whole of 2021, setting constraints for Singapore dollar gains despite extended dollar weakness and potential improvements in current account surpluses. Further monetary easing is unlikely this year as fiscal policy is doing the heavy lifting.”


USDSGD ANALYSISUSDSGD is trading in uptrend
Pair is based above key level at 1.3330
above HVN at level 1.3292
Above SMA 100
MACD shows weakness in bearish momentum
It's expected to target resistance level at 1.3415


USDSGD short trade ideaPlan: trendline and support level breakout --> wait for the price to bounce off from resistance level --> wait for the rejection candle pattern to form e.g. bearish engulfing, pinbar, etc --> SELL
**Disclaimer** the content on this analysis is subject to change at any time without notice, and is provided for the sole purpose of assisting traders to make independent investment decisions.
Traders!! if you like my ideas and do take the same trade as I do, please write it in a comment so we can manage the trade together.
_____________________________________________________________________________________________________________________
Thank you for your support ;)
GWBFX
USDSGD long trade ideaPlan : wait for the price to bounce off from trendline or support level --> wait for the rejection candle pattern to form e.g. bullish engulfing , pinbar etc --> BUY
**Disclaimer** the content on this analysis is subject to change at any time without notice, and is provided for the sole purpose of assisting traders to make independent investment decisions.
Traders!! if you like my ideas and do take the same trade like i do, please write it in comment so we can manage the trade together.
_____________________________________________________________________________________________________________________
Thank you for your support ;)
GWBFX


USD/SGD Long Position Buy Op
Daily/4Hr
Price has been in a downtrend but it is looking like we may have a reversal/breakout happening.
The 50MA has crossed over the 200MA on the 4hr and may be pulling back to the 200MA on the Daily.
Will be looking for my buy entry on the higher low/50MA on the 4hr chart and 1hr for candle confirmations.
Entry AREA 1.33360
SL 1.33008 (35Pips)
TP 1.35000 (163Pips) 1:4.66 Risk/Reward

💡Don't miss the great buy opportunity in USDSGDTrading suggestion:
". There is a possibility of temporary retracement to suggested support line (1.33410).
. if so, traders can set orders based on Price Action and expect to reach short-term targets."
Technical analysis:
. USDSGD is in a range bound and the beginning of uptrend is expected.
. The price is above the 21-Day WEMA which acts as a dynamic support.
. The RSI is at68.
Take Profits:
TP1= @ 1.33890
TP2= @ 1.34390
TP3= @ 1.35010
TP4= @ 1.35500
TP5= @ 1.36170
SL= Break below S2
❤️ If you find this helpful and want more FREE forecasts in TradingView
. . . . . Please show your support back,
. . . . . . . . Hit the 👍 LIKE button,
. . . . . . . . . . Drop some feedback below in the comment!
❤️ Your Support is very much 🙏 appreciated! ❤️
💎 Want us to help you become a better Forex trader ?
Now, It's your turn !
Be sure to leave a comment let us know how you see this opportunity and forecast.
Trade well, ❤️
ForecastCity English Support Team ❤️

💡Don't miss the great buy opportunity in USDSGDTrading suggestion:
". There is a possibility of temporary retracement to suggested support line (1.33410).
. if so, traders can set orders based on Price Action and expect to reach short-term targets."
Technical analysis:
. USDSGD is in a range bound and the beginning of uptrend is expected.
. The price is above the 21-Day WEMA which acts as a dynamic support.
. The RSI is at 68.
Take Profits:
TP1= @ 1.33890
TP2= @ 1.34390
TP3= @ 1.35010
TP4= @ 1.35500
TP5= @ 1.36170
SL= Break below S2
❤️ If you find this helpful and want more FREE forecasts in TradingView
. . . . . Please show your support back,
. . . . . . . . Hit the 👍 LIKE button,
. . . . . . . . . . Drop some feedback below in the comment!
❤️ Your Support is very much 🙏 appreciated! ❤️
💎 Want us to help you become a better Forex trader ?
Now, It's your turn !
Be sure to leave a comment let us know how you see this opportunity and forecast.
Trade well, ❤️
ForecastCity English Support Team ❤️

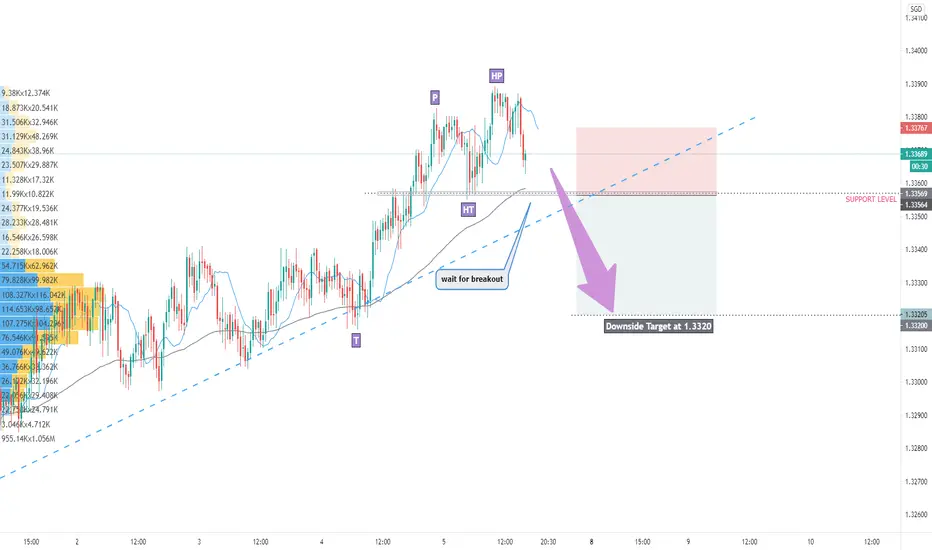
USDSGD can break a daily resistance? 🦐USDSGD on the 4h chart reached the daily resistance stricture.
The price after a consolidation attempt to break above.
According to Plancton's strategy, if the conditions will be satisfied, we can set a nice long order.
–––––
Follow the Shrimp
Keep in mind.
🟣 Purple structure -> Monthly structure.
🔴 Red structure -> Weekly structure.
🔵 Blue structure -> Daily structure.
🟡 Yellow structure -> 4h structure.
⚫️ Black structure -> >4h structure.
Here is the Plancton0618 technical analysis , please comment below if you have any question.
The ENTRY in the market will be taken only if the condition of the Plancton0618 strategy will trig

USD/SGD: DAILY PRICE ACTION + HARMONIC GARTLEY 🔔Welcome back Traders, Investors and Community!
Analysis of #USDSGD
If you have found this useful then help us support my page by hitting the LIKE button.
If you are not subscribed yet then please feel free to follow my page for daily updates and ideas. Thank you
It means a lot to us!
***
Strategy: We can see a Flag pattern + Bearish Gartley Pattern - We will be waiting for all the confirmations to enter in this trade.
A clear chart is Always the best business card for a trader.
***
Your support and feedback will always welcome
Thank you for your time.
The information contained herein is not intended to be a source of advice or credit analysis
Regards,
Walter


USDSGD Trade Set UpThis pair has been trending down since march 2020. I expect a total reversal now or a higher degree corrective structure. If it breaks the rejection zone then I expect a bull run. It can still take off after it takes its previous low. As the pattern develops i will keep this idea updated, so like, comment, follow so you don't miss any update. Thank you.

