SGDUSD trade ideas

The US surpassed 10 million total cases of COVID-19The pair will break down from a major support line, sending the pair lower towards the 1.32000 resistance area. Asia’s coronavirus cases remain stable despite the resurgence of the deadly virus in Europe and North America. This week, the US surpassed 10 million total cases of COVID-19 while some countries in Europe implemented a second lockdown. Meanwhile, Singapore had only 1-digit daily infection cases throughout November making Asia, particularly Singapore, a good investment hub for businesses. Aside from this, the country is looking to build up its reserves and take advantage of the weak US dollar. USD reserves by Singapore in October jumped to $338.0 billion compared to the prior month’s $328.0 billion. This, in turn, will hedge the Singaporean dollar against economic uncertainties. In other news, US Chamber of Commerce CEO Thomas Donohue calls for the passing of the new stimulus bill before the inauguration of Biden.

W46 - USDSGD rebound off mirror lineUSDSGD rebounded off mirror line @ 1.34504
Entry slightly above previous retest peak / support and resistance line (early 2020)
Entry at 1.35304
TP 25% each at 25%, 50% (s/r level) and 75% (0.382 fib lvl)
will let the balance 25% see how far it can go after that
RRR at 75% 3.05
RRR at top 9.02 but highly unlikely
Disclaimer: Using this as a journal for my own trades on a test account.

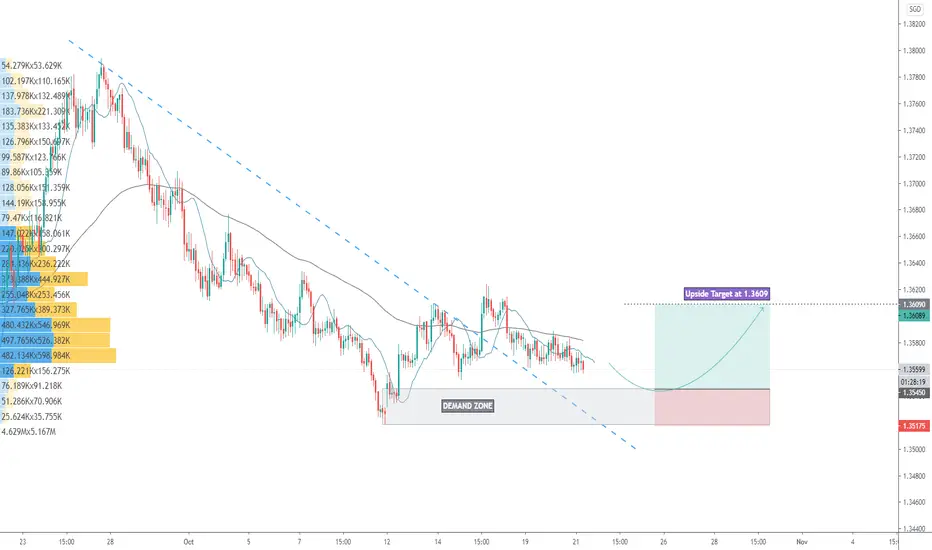
USD_SGD Good time to transfer to US account Weekly demand and oUSD_SGD
Good time to transfer to US account
Weekly demand and origin of the upmove from 19.2


Watching for Pullback Into ResistancePrice has now sold off heavily and broken through the key daily chart support level in this pair.
This old breakout support level looks like a key level in this pair.
If we can get a quick rotation back higher close to this level we could start to look for short trades inline with the recent momentum lower.
Short trades could be hunted on both the daily and smaller intraday time frames and depending on how aggressive you are you could look for confirmation or take a touch trade entry.

💡Don't miss the great buy opportunity in USDSGDMidterm forecast:
While the price is above the support 1.3400, beginning of uptrend is expected.
We make sure when the resistance at 1.3885 breaks.
If the support at 1.3400 is broken, the short-term forecast -beginning of uptrend- will be invalid.
Technical analysis:
There is a divergence in RSI and price between the trough at 1.3549 on 2020-09-01 and the trough at 1.3512 on 2020-10-22, the probability of downtrend continuation is decreased and the probability of beginning of uptrend is increased.
While the RSI downtrend #1 is not broken, bearish wave in price would continue.
A trough is formed in daily chart at 1.3510 on 10/22/2020, so more gains to resistance(s) 1.3550, 1.3675, 1.3785 and maximum to Major Resistance (1.3885) is expected.
Price is below WEMA21, if price rises more, this line can act as dynamic resistance against more gains.
Relative strength index (RSI) is 35.
Take Profits:
TP1 @ 1.3550
TP2 @ 1.3675
TP3 @ 1.3785
TP4 @ 1.3885
TP5 @ 1.4270
TP6 @ 1.4635
TP7 Free
❤️ If you find this helpful and want more FREE forecasts in TradingView
. . . . . Please show your support back,
. . . . . . . . Hit the 👍 LIKE button,
. . . . . . . . . . . Drop some feedback below in the comment!
❤️ Your Support is very much 🙏 appreciated! ❤️
💎 Want us to help you become a better Forex trader ?
Now, It's your turn !
Be sure to leave a comment let us know how do you see this opportunity and forecast.
Trade well, ❤️
ForecastCity English Support Team ❤️

USDSGD LongHi traders,
Everything is shaping up nicely for a long on USDSGD, I will therefore go long at market open with a 23 pip stop loss targeting 69 pips for a risk to reward of 1:3.
Best,
Don Deesker

Will Price Make Retracement Higher?In a very similar fashion to the USDJPY, this pair at the end of last week also sold off heavily and made a decent move lower.
Just like the USDJPY did also, this pair broke through a recent strong daily chart support level.
If we can see price make a rotation back higher into a value area, then we could look to make short trades.
Short trades would be inline with the recent strong momentum lower and at a key price flip level on the daily chart.

USD SGD BUY (US DOLLAR - SINGAPORE DOLLAR)Hi there. Price is forming a reversal pattern to change its direction. Watch strong price action at the current levels for buy.

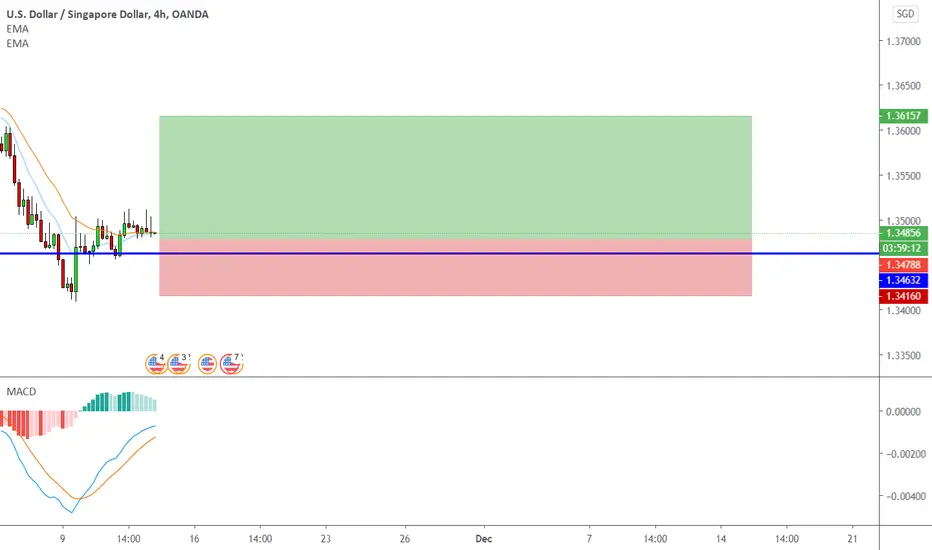
USDSGD long trade ideaPlan: wait for the price to bounce off from demand zone --> wait for the rejection candle pattern to form e.g. bullish engulfing, pinbar, etc --> BUY
**Disclaimer** the content on this analysis is subject to change at any time without notice, and is provided for the sole purpose of assisting traders to make independent investment decisions.
Traders!! if you like my ideas and do take the same trade as I do, please write it in a comment so we can manage the trade together.
_____________________________________________________________________________________________________________________
Thank you for your support ;)
GWBFX

USDSGD /Long/ DMy prediction is that USDSGD will go Long/D, the support is not breaking, but we have to wait for more consolidation.
GoodLuck!


USDSGD (4H) Backtest : 62% Win rate (12 R), 85% non-losers!Detailed backtest results
- prnt.sc
- Win/Loss ratio : 400%
- Non losers : 85%
- Net R : 12 R across 13 trades
- Avg R / winner = 1.5
- Avg R / trade = 0.92
Icons on the chart
- Thumbs up : Trade was a win
- Thumbs down : Trade was a loss
- Circle with a cross : Trade was breakeven
- Cross : Did not take the trade due to one or more trade qualifiers
- Bug : I could not understand how to trade, so avoided trading
Trade qualifiers
- $ icon : DXY was either supporting the trade direction (and we took the trade as win/loss/BE), or DXY was not supporting the trade direction (and trade was not taken)
- Dollar bill icon : Liquidity was present behind the stop loss
How to read icons on chart?
- Thumbs up + $ icon => Winner trade, direction was supported by DXY
- Thumbs down + $ icon => Loser trade, direction was supported by DXY
- Cross + $ icon => Trade skipped because DXY didn't support trade direction (though a liquidity hunt wasn't an issue)
- Cross + $ icon + Dollar bill => Trade skipped because DXY didn't support trade direction & a potential liquidity hunt was due near the stop loss
- Cross + Dollar bill => Trade skipped because a potential liquidity hunt was due near the stop loss (though DXY did support trade direction)
Indicators at bottom of chart
1) Count of HH/LL for the pair - shows when market structure is broken => Also generates a signal on the main chart (highlighted vertical lines)
2) Count of HH/LL for DXY - shows how the pair is moving in correlation to DXY
3) Correlation of the pair with DXY - just to give an idea about how the correlation is moving
Strategy
Pickup a pair which is highly correlated to DXY
AND
Wait for market structure to break, then trade the retest of that zone. Zone is drawn using the first candle which crossed the pivot high/low to begin trapping the traders
AND
Liquidity in form of equal highs/lows should not be present behind the stop loss
AND
Since the pair is highly correlated to DXY , the formation of HH/LL in DXY should support the trade's direction at the time of zone's formation
Risk management
1) Reduce 50% at 1R => Trade becomes risk free
2) Reduce further 25% at 2R AND move SL to break-even
3) Close trade at 3R
4) Winner = 1.75R
Variables
Avg winner = 1.75R
PS1 : Please excuse the busy chart!
PS2 : This backtest was performed right to left, so could include visibility bias. However, I tried to follow the strategy rules in all trades.

USDSGD: Momentum At PlayIf You have a different point of view Please kindly comment or post your chart image below and Substantiate.
*Note this my projection of price behavior and may be used for trading purpose, However CFDs are complex instruments and involve high Risk and may not be suitable for all investors. Past performance does not guarantee future results. All predictions are strictly speculative and for educational purposes only therefore Use effective risk management.Trading foreign exchange carries a high level of risk.


USDSGD double bottom and go 🦐USDSGD on the daily chart bounced over a weekly support at 1.35400.
The price started then a new impulse and soon will test a minor resistance.
IF the price will break and close above the structure we will set a nice long order according to Plancton's strategy.
–––––
Follow the Shrimp 🦐
Keep in mind.
🟣 Purple structure -> Monthly structure.
🔴 Red structure -> Weekly structure.
🔵 Blue structure -> Daily structure.
🟡 Yellow structure -> 4h structure.
⚫️ Black structure -> >4h structure.
Here is the Plancton0618 technical analysis , please comment below if you have any question.
The ENTRY in the market will be taken only if the condition of the Plancton0618 strategy will trigger.

USDCNH ANALYSISUSDSGD is in uptrendline
Price is based above key level at 1.3623
Above SMA 100
RSI is above level 50
Above HVN at level 1.3572
It's expected for the continuation of bullish momentum to target first resistance level at 1.3718
then finally target supply zone at level 1.3794
