USDSGD - Resistance becoming Support? Head&Shoulders necklineUSDSGD is exhibiting hints at a Reversal on the lower time frames with a volume blowoff during the last low pivot spike.
Currently price is at the neckline of a Head and Shoulders pattern which is a potential reversal pattern.
Important to watch price activity around the trendlines and the 200 MA for fake breaks and retests. Confirmation is required.
SGDUSD trade ideas

USDSGD - Long term Cycle trough reached?The SGD dollar has been strengthening since mid April and may be due for a reversion.
A rising Singapore dollar makes exports more expensive, (imports cheaper).
Currently, it has annual product exports of $323 billion and imports of $323 billion, giving it a neutral trade balance.
Price is currently approaching the lower edge of this cyclic range which may unbalance this neutrality if it exceeds it.

USDSGD - Bullish Price Divergence with Indicators USDSGD has been on a recent bearish run and many indicators are showing divergences on the shorter time frames.
It does seem to want to test the historical pivot low (1.31576) so could paint lower prices. Patience is required before entering on a confirmation of a bullish trend change/correction as there may be some false starts.

USDSGD LongIt's a long setup but not sure if bottom is in.
If price don't get rejected at 1.3282, then is could be heading for 1.3457.
Anyway, be cautious and do not get too excited trying to catch bottoms.

Opportunity to convert into USD US is expected to cut rates, bringing USD down. That said, we need USD to buy into the US market.
Levels to look out for is 1.305 and 1.32.

USDSGD Buy signal at the bottom of a Channel Down.The USDSGD pair has been trading within a Channel Down pattern since the April 16 2024 High and today almost touched its bottom (Lower Lows trend-line). That is a technical short-term buy opportunity towards its top (Lower Highs trend-line).
The previous Bullish Leg of the pattern registered a +1.31% rise. Our Target is slightly lower than a new potential rise of this magnitude at 1.35000.
-------------------------------------------------------------------------------
** Please LIKE 👍, FOLLOW ✅, SHARE 🙌 and COMMENT ✍ if you enjoy this idea! Also share your ideas and charts in the comments section below! This is best way to keep it relevant, support us, keep the content here free and allow the idea to reach as many people as possible. **
-------------------------------------------------------------------------------
💸💸💸💸💸💸
👇 👇 👇 👇 👇 👇

USDSGD Trading Signal: Buy OpportunityDear Traders,
Based on our latest analysis, we have identified a promising buy opportunity for the USDSGD currency pair, utilizing the cutting-edge EASY Quantum Ai strategy.
Direction: Buy
Enter Price: 1.34332
Take Profit: 1.34506333
Stop Loss: 1.34123333
Justification for the Signal:
1. Technical Analysis: Our proprietary EASY Quantum Ai model has detected a bullish trend formation on the USDSGD chart. Key technical indicators such as the Moving Average and Relative Strength Index (RSI) show positive momentum, supporting an upward price movement.
2. Market Sentiment: Recent market data indicates a growing demand for USD against the SGD. Factors such as economic stability in the US and increased investor confidence contribute to USD strength, making now an opportune moment to enter a buy trade.
3. Fundamental Factors: Economic indicators from the US, such as recent GDP growth and employment data, suggest a robust economic outlook. Additionally, Singapore's monetary policy suggests a stable but slower growth rate, favoring a stronger USD over SGD.
We advise you to place your buy orders at the specified entry price and monitor the trade as it reaches the target take profit and stop loss levels. Good luck with your trading, and stay tuned for more updates from our EASY Quantum Ai strategy!
Happy trading,
Your Trading Team

USDSGD: ITF CURVE ANALYSIS (10H) - UPTREND✨ USDSGD: ITF CURVE ANALYSIS (10H) ✨ (UPTREND)
BLO2 @ 1.33803 ⏳
BLO1 @ 1.34127 TRIGGERED
MO @ 1.3419 (DEPENDING ON YOUR TRADING PLAN/THRESHOLD
TP1 @ 1.34658
TP1a @ 1.3520 (Secret TP1)
TP2 @ 1.35537
TP3 @ 1.36092
TP3a @ 1.3645 (Secret TP2)
SLO1 @ 1.36505⏳
🔑
BLO = BUY LIMIT ORDER
ITF = INTERMEDIATE TIME FRAME
MO = MARKET ORDER
SLO = SELL LIMIT ORDER
TP = TAKE PROFIT
NOTE: Happy Friday all! Figured I'd provide one more opportunity that I'm engaged in for your viewing pleasure. Let's see what happens...
Intermediate time frames (4 hours to 6 day):
— Offer a clearer picture of the underlying trend compared to short-term frames.
— Provide more opportunities for confirmation signals and technical analysis.
— Allow for more flexible trading schedules, trades can be held overnight.
— Suitable for swing traders and some positional traders.

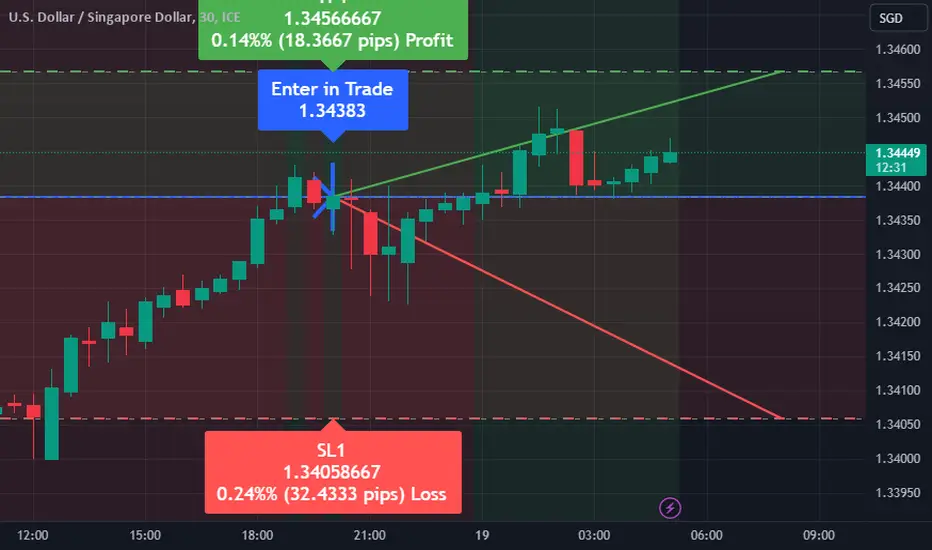
USDSGD Trading Signal: BuyEnter Price: 1.34383
Take Profit: 1.34566667
Stop Loss: 1.34058667
Signal Summary:
Buy USDSGD at 1.34383 with a target profit level at 1.34566667 and a stop loss at 1.34058667.
Justification:
This trading signal is generated using the EASY Quantum Ai strategy. The decision to go long on the USDSGD currency pair is based on the following factors:
1. Trend Analysis: The recent price movements indicate a bullish trend for USDSGD. Historical data supports the continuation of this trend.
2. Technical Indicators: Key technical indicators such as RSI and MACD exhibit bullish signals. The RSI is moving upwards, and the MACD line is positioned above the signal line.
3. Support and Resistance Levels: The support level is identified near the stop loss at 1.34058667, providing a safeguard against downward volatility. The resistance level aligns with the take profit at 1.34566667, suggesting potential upward movement.
4. Market Sentiment: Current market sentiments, driven by economic reports and investor behavior, favor an appreciation of the USD against the SGD.
Risk Management:
Setting the stop loss at 1.34058667 ensures that potential losses are minimized, while the take profit at 1.34566667 aims for a reasonable gain, aligning with the identified resistance level.
Monitor the trade closely, adjusting the strategy as necessary. Happy trading!
EASY Quantum Ai Strategy Team
USDSGD: ITF CURVE ANALYSIS (17H) - DOWNTREND✨ USDSGD: ITF CURVE ANALYSIS (17H) ✨ (DOWNTREND)
SLO2 @ 1.36505 ⏳
SLO1 @ 1.36106 ⏳
TP1 @ 1.35344
TP2 @ 1.34233
TP3 @ 1.33505
BLO1 @ 1.33331⏳
BLO2 @ 1.32906⏳
🔑
BLO = BUY LIMIT ORDER
CP = CURRENT PRICE
ITF = INTERMEDIATE TIME FRAME
MO = MARKET ORDER
SLO = SELL LIMIT ORDER
TP = TAKE PROFIT
DISCLAIMER NOTE: There are a couple of options with this trade. This analysis is the most safe and conservative. However, there may be an opportunity for a short term long from CP as a MO (1.3505) or at approximately around 1.3490 with a TP1 of 1.3610 (R:R of 6:1) & TP2 of 1.3645 (R:R of 7.5:1).....This is just an analysis NOT a solicit to engage in any trade. You assume sole risk if you decide to take any trade. As a professional, I know how to navigate this potential opportunity. Just sharing an idea.
Intermediate time frames (4 hours to 6 day):
— Offer a clearer picture of the underlying trend compared to short-term frames.
— Provide more opportunities for confirmation signals and technical analysis.
— Allow for more flexible trading schedules, trades can be held overnight.
— Suitable for swing traders and some positional traders.

#USD #SDG LONG Set Up1H chart is showing some sign of life and little reversal. Will long and have my entry / buy stop at 1.34443. Mind you we have Empire State Manufacturing Index and powell speech. Prepare for some volatility
Entry 1.34443
Stoploss 1.34043
TP-1 1.34840
TP-2 1.35240

Join Uptrend in USDSGDJoin Uptrend
Entry above 1.3676
Protective Stop 1.3813
Target 1: 50% of the size 1 to 1 risk to reward 1.3945
Target 2 above 1.41
Move stop to breakeven when it hits Target 1
Keep managing stop if continues to rally

USDSGD buy setup !USDSGD is getting ready for go up. Its coming from a very strong support area and now its time to buy the pair. 1:3 Return I'm expecting from this trade.

UsdSgd - ShortWith the DXY signaling a decline, we also expect a drop in USD/SGD. The price, forming a double top pattern, has started a corrective rise from the peak of the ascending channel. We might see a rise up to the neckline of the double top. Following that, our first target is the 23.6% Fibonacci retracement level, and if this level is breached, the 38.2% Fibonacci retracement zone.

USDSGD: One more wave v) of (b) to downside to 1.2900DISCLAIMER : All labelling and wave counts done by me by manually and i will keep change according to the LIVE MARKET PRICE ACTION. So don't bias, hope on my trade plans...try to learn and make your own strategy...Following is not that much easy...I AM NOT RESPONSIBLE FOR ANY LOSSES IF U TOOK THE TRADE ACCORDING TO MY TRADE PLANS....THANKS LOT..CHEERS

USD SGD Short Set upEntry 1.35045
Stoploss 1.35228
TP-1 1.34860
TP-2 1.34680
#Trading #Technical #Crypto #Stocks #commodities

AUD/CAD Short, GBP/CHF Short, AUD/CHF Short and USD/SGD ShortAUD/CAD Short
Minimum entry requirements:
• If 3 touch 1H continuation or 2 touch 1H continuation with 3 touch structural approach, 15 min risk entry within it.
GBP/CHF Short
Minimum entry requirements:
• If 3 touch 1H continuation or 2 touch 1H continuation with 3 touch structural approach, 15 min risk entry within it.
AUD/CHF Short
Minimum entry requirements:
• If 3 touch 1H continuation or 2 touch 1H continuation with 3 touch structural approach, 15 min risk entry within it.
USD/SGD Short
Minimum entry requirements:
• 1H impulse down.
• 3 touch 15 min continuation or 2 touch 15 min continuation with 3 touch structural approach, 5 min risk entry within it, or reduced risk entry on the break of it.

USDSGD Bullish unless this Support breaks.The USDSGD pair is on the 1D MA50 (blue trend-line) currently but within conflicting Channels. The long-term one is a Channel Up that hasn't yet been invalidated, the medium term one a Channel Down and the shortest term a Channel Up.
As long as Support 1 (1.34225) holds, we will go with the short-term Channel Up and stay bullish, targeting 1.37250, which will be a Lower High on the medium-term Channel Down. If on the other hand, Support 1 breaks, we will take the loss and go short instead, targeting 1.32725 (Support 2).
-------------------------------------------------------------------------------
** Please LIKE 👍, FOLLOW ✅, SHARE 🙌 and COMMENT ✍ if you enjoy this idea! Also share your ideas and charts in the comments section below! This is best way to keep it relevant, support us, keep the content here free and allow the idea to reach as many people as possible. **
-------------------------------------------------------------------------------
💸💸💸💸💸💸
👇 👇 👇 👇 👇 👇

GBP/CHF Short and USD/SGD ShortGBP/CHF Short
Minimum entry requirements:
• Tap into area of value.
• Risk entry after a 1H rejection or a phase line break.
USD/SGD Short
Minimum entry requirements:
• 1H impulse down below most recent low.
• If 2 touch 5 min continuation, reduced risk entry on the break of it.
• If 2 touch 15 min continuation, 5 min risk entry within it, or reduced risk entry on the break of it.

the pair is waiting for trendline reactionthe pair is waiting for trenline reaction but our main scenario is bearish .
we are following up to enter short
if you have any comments pls share


USDSGD SELLS @ 1.351Selling USDSGD here, price is at supply. Only issue with this trade is price dipped into weekly demand. However, I'd expect price to retrace back into the demand before firing up to weekly supply.

AB-CD Bullish reversal pattern formingAn excellent trading opportunity, for this pair on the 4H time frame as 2 opportunities are presented according to my analysis.
