My Weekly Analysis 61 Pt. 2I go through my currency pairs and analyze them while listening to music and talk to you guys.
*not a financial advisor*
SGDUSD trade ideas

USDSGD ____ INCOMING BULLISH MOVEHey Guys,
USDSGD hunted sell-side liquidity last week Thursday & Friday and also traded into the weekly FVG. From the weekly FVG, I speculate that the price will rally to hunt the buy-side liquidity and head into the daily FVG.
However, I expect that price will try again to go lower at the beginning of the week and start the bullish rally.
Also, as a confluence, the dollar index is also getting ready for the bullish rally (see below my analysis on DXY)
Follow for more updates.
Feel free to DM me.
See my Dollar Index analysis
Other USD-related pairs
GBPUSD
NZDUSD
USDJPY
Cheers,
Jabari

My Weekly Analysis 60 Pt. 2I go through my currency pairs and analyze them while listening to music and talk to you guys.
*not a financial advisor*

USDSGD (Bearish Harmonic Pattern)Pattern Bearish Harmonic Pattern
Pair USDSGD
Sell Stop 1.35288
TP 1.35019
TP 1.35019

USDSGD Triangle break-out. Buy signal.Last time we looked at the USDSGD pair (October 11 2022) we gave the best sell signal possible (see idea below) as the price entered the 6 year Resistance Zone:
This time we have a buy signal flashing as the price not only broke above the Triangle pattern on the 1D time-frame but also above the 1D MA50 (blue trend-line). As long as Support 1 holds, we are bullish targeting 1.35500. If Support 1 breaks (1.32050), we will book the loss and open a sell, targeting 1.30550.
-------------------------------------------------------------------------------
** Please LIKE 👍, FOLLOW ✅, SHARE 🙌 and COMMENT ✍ if you enjoy this idea! Also share your ideas and charts in the comments section below! **
-------------------------------------------------------------------------------
💸💸💸💸💸💸
👇 👇 👇 👇 👇 👇

USDSGD _____ UPCOMING BULLISH MOVEHello Traders,
If you are following me, you would know by now that I have a bullish bias on USD. This bias is based on my analysis of the Dollar Index. However, USDSGD just entered a key demand level and I am waiting for CHOCH for me to go long on this pair.
I have also done an analysis on GBPUSD and it is currently playing out as speculated. (see below)
Also, see my analysis of the dollar index below.
What do you think? is there something you think I might have missed or you agree with me?
Let me know your thoughts.
Cheers,
David

USD/SGD springboardTurtle soup / bear trap / range bottom fake-out that led to the break-out on the opposite side. Strong bullish daily candlestick closed above EMAs and the resistance levels. Entering on M5 pullback at the confluence of 61.8% fib retrace and range top. Target at -27.8% of fibo retrace.

USDSGD 27/04/2023Monthly:
-Monthly lows.
Weekly:
-IC attracting the price.
Daily:
-Bullish M pattern.
-IC.
4H:
-Bullish M pattern.
-IC.

Short USDSGD on Weekly .382 RetracementThe weekly chart of the USDSGD shows clearly the weakness of the USD against the SGD. This weakness has been building for a while now. The fact that it has retraced just below the .382 level indicates a long term weakness in USD despite Fed Rate hikes. For Singapore which has an export based economy, this is significant as it makes the country less competitive. However, it does help to combat inflation. Perhaps funds inflows from wealthy individuals elsewhere in the world would help in SGD strength.


USDSGD Reaching a key level to watch**Find out more from my Tradingview Stream this week**
***************************************************************************************
Hello there!
If you like my analysis and it helped you ,do give me a thumbs ups on tradingview! 🙏
And if you would like to show further support for me, you can gift me some coins on tradingview! 😁
Thank you!
Disclaimers:
The analysis shared through this channel are purely for educational and entertainment purposes only. They are by no means professional advice for individual/s to enter trades for investment or trading purposes.
The author/producer of these content shall not and will not be responsible for any form of financial/physical/assets losses incurred from trades executed from the derived conclusion of the individual from these content shared.
Thank you, and please do your due diligence before any putting on any trades!

USD/SGD ShortPositive Confluence Factors... (12)
1. LTF and HTF direction in alignment? ✅
2. At edge of HTF structure (in green zone)? ✅
3. HTF candlestick confirmation?
4. Trade setup visible on multiple time frames? ✅
5. Break out of structure and a break back in present? ✅
6. Near miss present (below price if looking to get short, or above price if looking to get long)? ✅
7. Reliable looking sequence of flags present (if looking for further continuation)? ✅
8. Correction/s I'm looking to get long or short within and/or on the break of proportionate to preceding impulse? ✅
9. M style pattern present?
10. Structural approach to area of value?
11. Fairly flat structure present? ✅
12. Expanding pattern present? ✅
13. Equal spacing present?
14. Clearly identifiable middle section present? ✅
15. Head and shoulders pattern present?
16. Decent R:R available? ✅
17. No hook point sat just beyond stop loss?
19. Protection available for your stop loss? ✅
Negative Confluence Factors... (2)
1. Counter to HTF trend?
2. Not at edge of HTF structure (in red zone)?
3. Trade setup only visible on one time frame?
4. Price only wicked to area of value on multiple time frames?
5. Near miss present (above price if looking to get short, or below price if looking to get long)? ❌
6. Unreliable looking sequence of flags present (if looking for further continuation)?
7. Correction/s I'm looking to get long or short within and/or on the break of disproportionate to preceding impulse?
8. Squeeze present (structure not parallel or expanding)?
9. Fairly steep structure present?
10. Very unequal spacing present?
11. No clearly identifiable middle section present?
12. Multiple possible entry types?
13. Limited R:R available?
14. Hook point sat just beyond stop loss? ❌
15. Entry around swap hours?
16. Entry directly before major news announcement?
USD/SGD Long• If price impulses up, it does so in a convincing manner and a tight flag forms, then I'll be looking to get long with either a reduced risk entry on the break of the flag or a risk entry within it.
• If my entry requirements are not met then I will simply wait until another setup which meets my plan materialises.
• If there's any ambiguity then I will not place a trade on this pair.

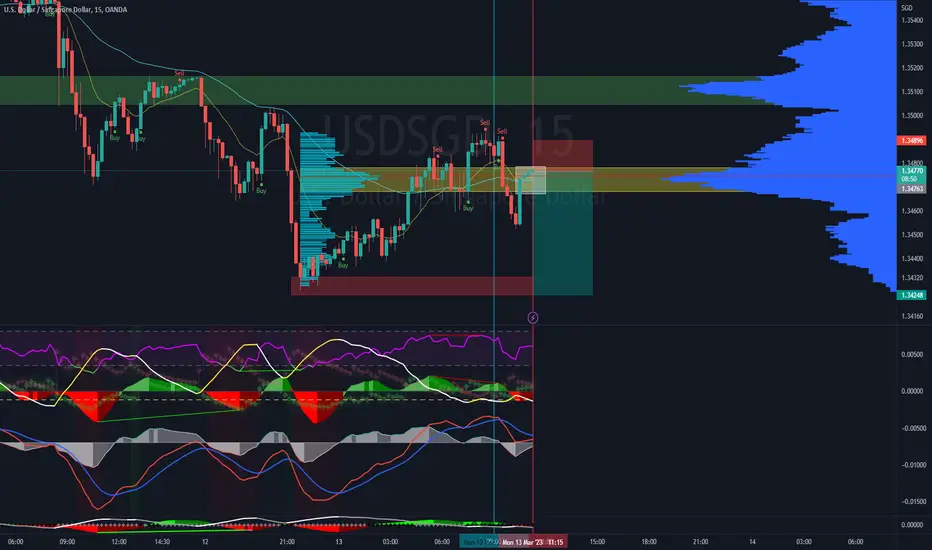
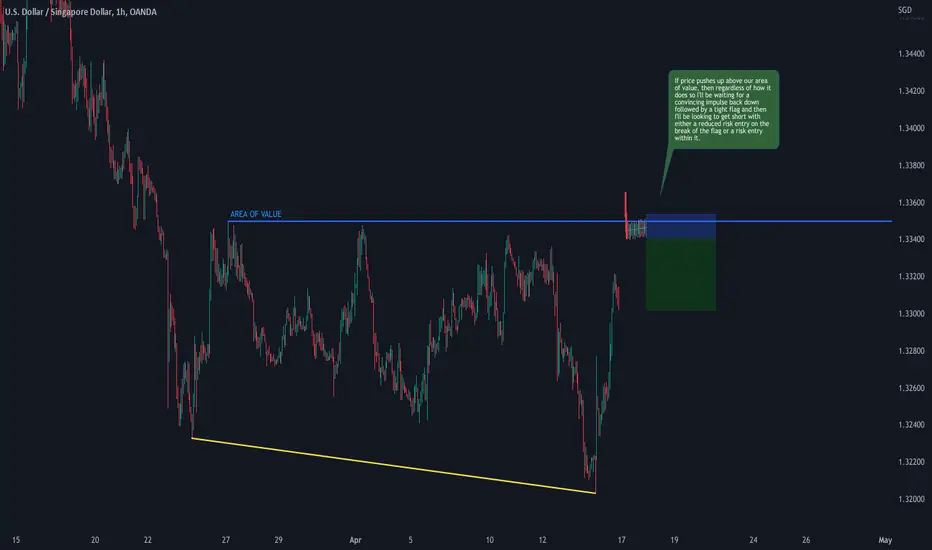
USD/SGD Short• If price pushes up to and ideally just above our area of value, then regardless of how it does so I'll be waiting for a convincing impulse back down followed by a tight flag and then I'll be looking to get short with either a reduced risk entry on the break of the flag or a risk entry within it.
• If my entry requirements are not met then I will simply wait until another setup which meets my plan materialises.
• If there's any ambiguity then I will not place a trade on this pair.

USDSGD LONGPossible upward movement of the pair. Price is currently in a lower bound trading zone with significant volume making stops and holding rejections at the bottom of the price near the 55 period EMA , essential in my strategy for analysis of potential trend continuations. Indicators like Squeeze Momentum and the MACD histogram have turned bullish after their red valley; accompanied by the loss of bearish strength indicated by the ADX rebounding towards the EMA . The MACD lines would be giving a possible buy signal soon. I think you could go looking for the previous high price zone when you see indications of a bounce move higher on the 4-hour chart. In 1 hour timeframes we see that it has broken the bearish structure, forming higher lows than the previous ones.
If you are going to take my opinion into account, please respect the projection time, this is extremely important. If it is not fulfilled in the foreseen time and makes a range, it will be better to close the operation in case it is possible.

USD/SGD - SellLike to buy USD against SGD at 1.33180 where stop loss at 1.33510 and profit target around 3:1


usdsgd a down trend It is down on the daily and h4 timeframe..just look for setup to go short.
Hello there!
If you like my analysis and it helped you ,do give me a thumbs ups on tradingview! 🙏
And if you would like to show further support for me, you can gift me some coins on tradingview! 😁
Thank you!
Disclaimers:
The analysis shared through this channel are purely for educational and entertainment purposes only. They are by no means professional advice for individual/s to enter trades for investment or trading purposes.
The author/producer of these content shall not and will not be responsible for any form of financial/physical/assets losses incurred from trades executed from the derived conclusion of the individual from these content shared.
Thank you, and please do your due diligence before any putting on any trades!

USD/SGD LongOANDA:USDSGD
USD/SGD has broke out of a nice descending wedge.
MACD showing some bull divergence.
Looks like a run to at least the 50% or 61.8% Fibonacci retracement level is likely.
Target 1 = 1.376
Target 2 = 1.393
Long.
Fat_Fat

USDSGD - bigger correction to goIdea is in the chart.
RSI divergence + Deviation + Trendline break.
Down.

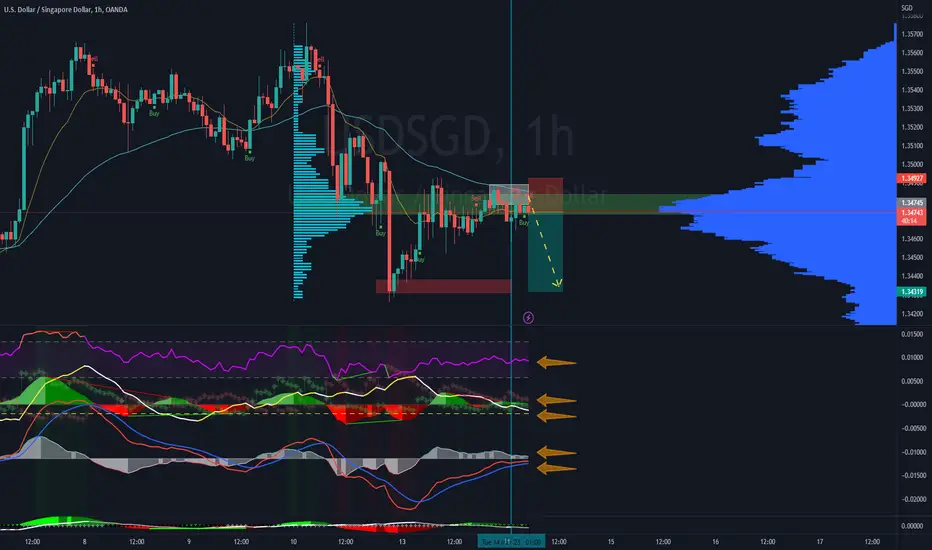
USDSGD SHORTPossible bearish movement of the pair. The price is currently in a trading zone with significant volume , with rejections at the top of the price right at the 55 period EMA , which is essential in my strategy for analysis of possible trend continuations. We also see significant development in the Squeeze momentum indicator and macd histogram monitors, with directionality changes to bearish confirmed. We see the attached ADX indicator entering below the 23 level line (0 point of the MACD histogram), indicating the weakness of the previous move higher as it bounced towards the 55 period EMA , to continue falling as the moves have indicated. previous; along with a possible sell signal pattern coming soon on the MACD lines. There could be a continuation of the downtrend.
If you are going to take my opinion into account, please respect the projection time, this is extremely important. If it is not fulfilled in the foreseen time and it makes a range, it will be better to close the operation in case it is possible.