How to create alert on Trading ViewQuick video on how to create price trigger alert.
This is to alert the trader to prepare to make an entry if the price nears the price that they want to enter.
AIY trade ideas

AIY is on uptrend channel. It is approaching channel lower band.AIY is on uptrend channel. It is approaching channel lower band. Monitor for possible reversal up signal.
#ARTTpick #KebayaTrader

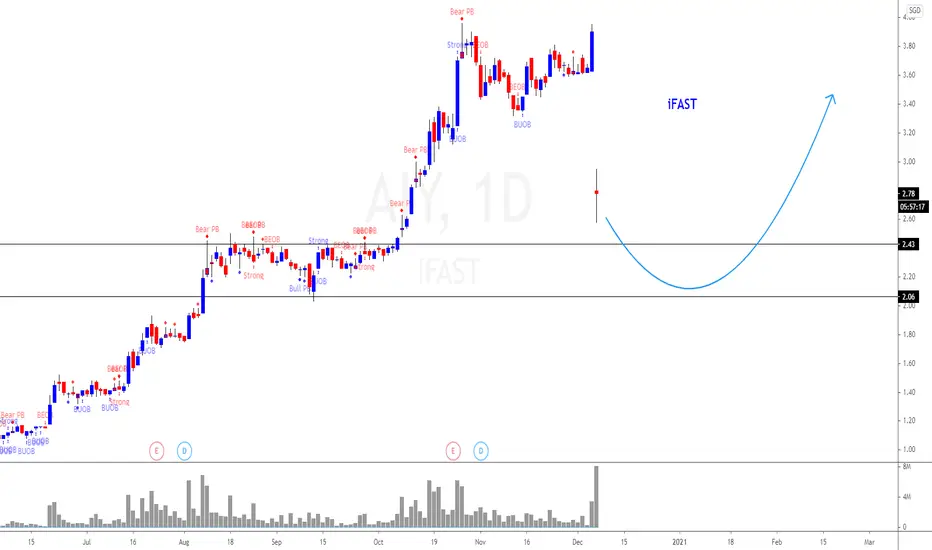
Ifast - potential war horse Chart pattern using line charting to eliminate noise in market. Potential wave chart pattern as shown. Simplicity is the best~!
Mid to long term trend.
Give a thumbs up if you agree with the idea :)


AIY.SGX_Retracement Trade_LongENTRY: 9.55
SL: 8.91
TP: 10.10
- ADX>20
- RSI>50,RSI<70
- Daily RS +ve
- Daily FFI -ve
- Daily MACD -ve
- Weekly RS +ve
- Weekly FFI -ve
- Weekly MACD -ve
- Retraced to 61.8% fib level, and rebounded on 8 Oct 2021 with volume.
- Looks like volume dry up today after yesterday selling volume, which is a possible bullish sign.
- Earnings on 21 Oct 2021 to watch out for which should be good based on the numerous news they accumulated over the months.

<TradeVSA> Re-accumulation Completed with NS Sign of Strength in the chart:
1. NS Signal as Support
2. VCP setup
3. Pocket Pivot
Disclaimer
This information only serves as reference information and does not constitute a buy or sell call. Conduct your own research and assessment before deciding to buy or sell any stock

[Analysis] iFast (AIY)(SG) Bullish but, plan for averaging downDespite the recent 19% retracement from the All-Time High of 9.680 to a low of 7.80, iFast is still extremely Bullish in terms of a long-term trend.
As investors or even mid-term traders, one's strategy should always account for such a level of retracement.
The current support level is at 7.770 to 8.00. If you are looking to purchase at a lower price than the current price, this is the level that you should be looking at. When dealing with uptrend stocks, it is never wrong to buy in at the current price because you do not want to risk missing out on an entry when it suddenly rallies to a high price. However, most investors mistake putting up all the funds available and not accounting for a possible retrace. If the price does retrace, you will want to take advantage of the lower prices by averaging down. This assumes that your risk on all of your positions (including averaging down) is within your tolerance.
The next support level is at 5.500-6.500.
Beyond 5.500 is bear territory, and you should not hold beyond that. Hence you can work out your risk and entry strategy using 5.500 as a cut-off price.
I personally like to go the 40-40-20 route.
40% of the allocated fund at the current price
40% of the allocated fund to average down at first support
20% of the allocated fund to average down at second support (lesser weightage as chances if price reaching that level is not high)
If the price goes below 5.500, you have to ensure you are within your risk tolerance for 100% of your position.
"Plan the Trade"
"Trade the Plan"!

<TradeVSA> VCP Setup in IFASTSign of Strength in the chart:
1. Reaccumulation with VCP Pattern
2. High volume Upbar testing Resistance
3. NS signal with price above 20/40ma
Disclaimer
This information only serves as reference information and does not constitute a buy or sell call. Conduct your own research and assessment before deciding to buy or sell any stock

#SingaporeStock $IFAST(AIY.SI) #IFAST More Upside!#SingaporeStock $IFAST(AIY.SI) #IFAST
Daily Chart.
Price broke above 20 & 10 ema.
Still possible to retest 5.55
Upside possible target: 6.5 if you are holding.
Slow Stoch up. Wait for LMACD to curl up for trend confirmation.
.
This is #PersonalOpinion. Pls #DoYourOwnDueDiligence
#PeterSinGuili
#SwingTrading


#SingaporeStock #IFAST #AIY$IFAST(AIY.SI)
#SingaporeStock #IFAST #AIY.
Decision point. with key levels. If price doesnt hold, looking for further pullback to 5-5.50 for possible entries.
This is #PersonalOpinion. Please #DYOR.
.
#PeterSinGuili
#TechnicalAnalysis
#SwingTrading
#Investment

iFast (It drops Fast too)View On i Fast (7 Dec 2020)
What a drop!
We are seeing a sharp rise in the today volume as well.
It is a sign of a lot of SL get triggered.
You need to be careful with buying in. You might get lucky but the risk are there too. So, be very careful with buying in right now.
$2-$2.4 will be the strong support region.
DYODD, all the best and read the disclaimer too.
Feel Free to "Follow", press "LIKE" "Comment".
Thank You!
Legal Risk Disclosure:
Trading foreign exchange or CFD on margin carries a high level of risk, and may not be suitable for all investors. The high degree of leverage can work against you as well as for you. Before deciding to trade foreign exchange you should carefully consider your investment objectives, level of experience and risk appetite. The possibility exists that you could sustain a loss of some or all of your initial investment and therefore you should not invest money that you cannot afford to lose. You should be aware of all the risks associated with foreign exchange trading, and seek advice from an independent financial advisor.
DISCLAIMER:
Any opinions, news, research, analyses, prices or other information discussed in this presentation or linked to from this presentation are provided as general market commentary and do not constitute investment advice. Sonicr Mastery Team does not accept liability for any loss or damage, including without limitation to, any loss of profit, which may arise directly or indirectly from use of or reliance on such information.

IFAST - Bull PennantIFAST has been consolidating in a Bull Pennant for the past couple of week. Long within this pennant from 1.40-1.46 with initial stop just below the pennant @ 1.39. Matter of time. Be patient. :)
Disclaimer: This is just my own analysis and opinion for discussion and is not a trade advice. Kindly do your own due diligence and trade according to your own risk tolerance. Thank you.

IFAST - Bearish Reversal with slow accumulation phraseUsing Bollinger Band and the combination of the Relative Strength Index (RSI) above will help us to better time our entry and exit points. RSI is a momentum indicator that measures the magnitude of recent price changes to evaluate overbought or oversold conditions in the price of a stock. A reading close to 70 can be interpreted as overbought or a bullish trend reversal. While a reading of 30 can be interpreted as oversold indicating a bullish trend reversal.
In August 2019, we have seen signs of oversold in the RSI indicator hovering below 30. The lower limit Bollinger band has been a helpful supporting line supporting and stabilizing the price between $0.99 to $1.03. This stock has been going into accumulation phrase with buyer slowly buying stock in slow motion through the time and sales. We do not see opportunity in doing short-term scalping for sideway range movement as the range is small. We might see a breakout soon, as the Bollinger bandwidth getting smaller and smaller which is also known as Bollinger band squeeze. With a Bollinger band squeeze, there will be a potential breakout ahead. In this case, we will favor a strong upward move with the oversold RSI confirmation. The entry price will be between $1.01 to $1.04 with a first level take profit of $1.20. We will set a stop limit @ $0.96 to limit potential downside risk in case there is a heavy selldown that invalidate our analysis.
