TOPGLOV's 2.50 is a call "to" Sell"? or "For" Sale"!? 21/9/21A Prominent Fundamentalist have called TOPGLOV price for RM3.50 and RM2.80 in "Excel" format on TopGlove Website. Is This a call to "Sell" OR..For "Super Sales"?! .. RM2.50 ="Super Bargain Sale Price" could come much earlier in this few days than expected.. Where RM2.50 Got lot of "Bargain Hunter":--- 1)"Cyan Rectangle Box""Demand" Buyer 2) Lower Parallel Channel (Red) (Buyers) 3) Up Trend Line (Blue Dashed Line ) Buyers...4) A Fixed monthly "Cycle Buyers" (below cyan time cycle)
BVA trade ideas

TOPGLOV's wyckoff analysis. 19/9/21I've just been "dissecting" TOPGLOV chart structure. It seem like we've just completed wave 4 (yellow) of wave 3 (Red Circled) ONLY!!..Just about 20%-30% left to complete wave a (Green)..So topglove price most likely will break RM9.765 within 6-12 months ..

TOPGLOV may break 9.765 if with expanding flat pattern. 18/9/21TOPGLOV price could break all time high at RM9.765 as there is a based on "just 3 of the possibilities" :
1) Price of KLCI could break all time toward around 2000. TOPGLOV As a main "contributor" of KLCI index could break all time high as well.
2) Current TopGlov Price Cycle Analysis showing it's start moving up till 1st quarter of next year
3) TOPGLOV current wave structure have high probability to form an ABC (Red Circled) "Expanding Flat Pattern" .. which happened most of the time in wave b (Green)

Topglove Last HopeWish the stock price will rebound @ Support at 2.90, last hope. The world Number 1 glove manufacturer, Topglove gogogo!

TOPGLOV may completed its wedge pattern. 16/9/21Big Funds Could Sell on "Rumors" , Buy On Coming 17 Sept 2021 TOPGLOV's earning "News"..

TOPGLOV - Follow up, further downside expectedFollowing up from my Nov 22, 2020 post, prices have trended significantly lower from then RM7.29 to close at RM3.72 today.
While prices seem to be temporary supported at the RM3.68 area, it is good to note that if this area gets broken on the downside, steep slide will be expected.
Good luck. Next area of support RM2.30.

Possible plunge to RM1.70?Price will rally further if unable to withstand selling pressure at 3.1
Next target point will be approximately at 1.80.
That will be a good buy if price drop to 1.60-1.85
Yield range will be approx 10%
P/S: this is not a buy sell call

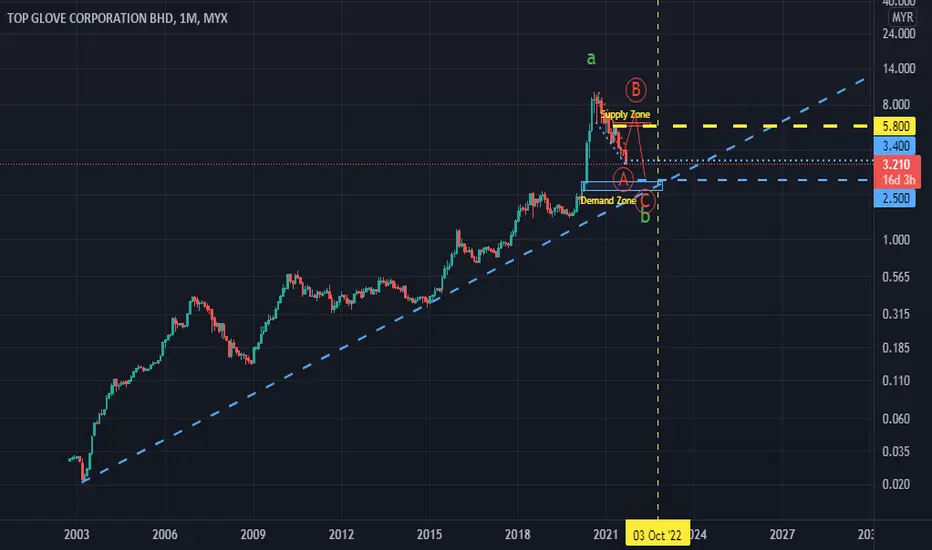
TOPGLOV May Drop to 2.50. BUT 5.80 First. 14/9/21TOPGLOV Stock price may drop until around RM2.50 where there is a confluence zone of 1) Major Monthly Demand Zone 2) A Long Term Up Trend Line Support ( Cyan/Light Blue Dashed Line) ..BUT... Price most likely will complete wave A (Red Circled) at around RM3.20 AND start trending up for wave B (Red Circled) till around RM5.80 where is confluence zone of 1) Next Major Supply Zone 2) Fibonacci 38.2% downtrend pullback from history high
TOPGLOV: Decline to $3.50Repeating pattern
- Rising wedge (bearish)
- Breakdown from wedge = sharp fall
- Technical rebound (yellow box)
- Sharp fall continues/intensifies

TOPGLOV most likely last leg down to around 3.40.. 30/8/21Congratulation for those still holding TOPGLOV stock!!... TOPGLOV as 1 of the 30 "Blue Chips" stocks comprising KLCI index which has turned into Bullish Sentiment. What could be the next move of TOPGLOV , HARTA AND KOSSAN ?...All 3's which making the "major contribution" to KLCI index.. Checking from TOPGOV's intraday price structure.. TOPGLOV most likely on its final leg down to complete its triple zig zag ( WXYXZ) (red circled) AND Wedge pattern where Bullish sentiment will be "on" at around RM3.400 at 1) Major Weekly Demand Zone 2)Weekly 233 EMA lines..

Will next Quarter Dividend be higher or lower than last quarter?31st August we will know if Top Glove can match 16 sen dividend given this quarter or the record 23 sen the quarter before that

TOPGLOV ≈ " RM4.90 / Early August are the "critical" Price/Time"Top Glove may find its next resistance zone at around RM4.90 in early August ( Maybe just "Before" US Next Stimulus Plan or "After" US None Farm Payroll Announcement"...


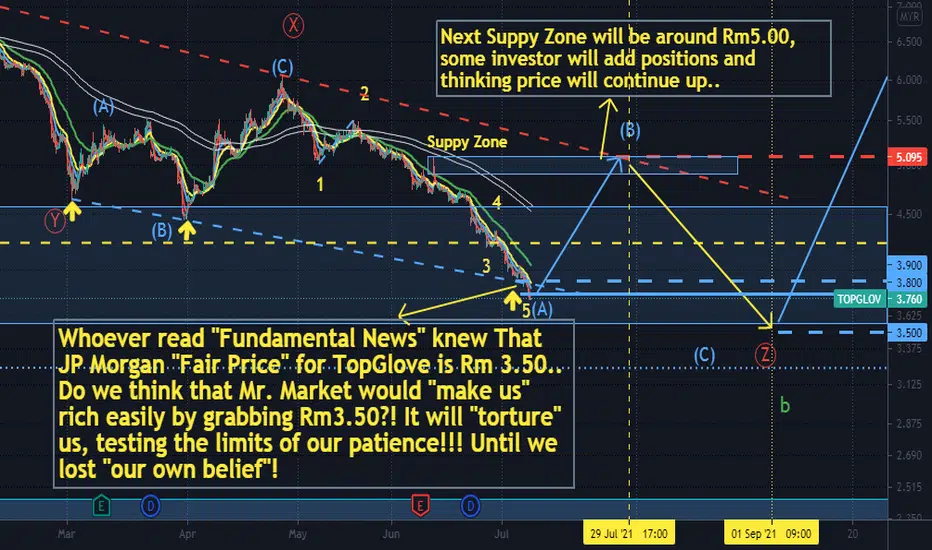
TOPGLOV can we can grab the "Auction Price" of Rm3.50 "easily"?!Whoever read "Fundamental News" knew That JP Morgan "Fair Price" for TopGlove is Rm 3.50.. Do we think that Mr. Market would help us making our bank account fatter easily by grabbing Rm3.50?! Probably Nope! It will "torture" us, testing the limits of our patience!!! Until we lost "our own belief"!
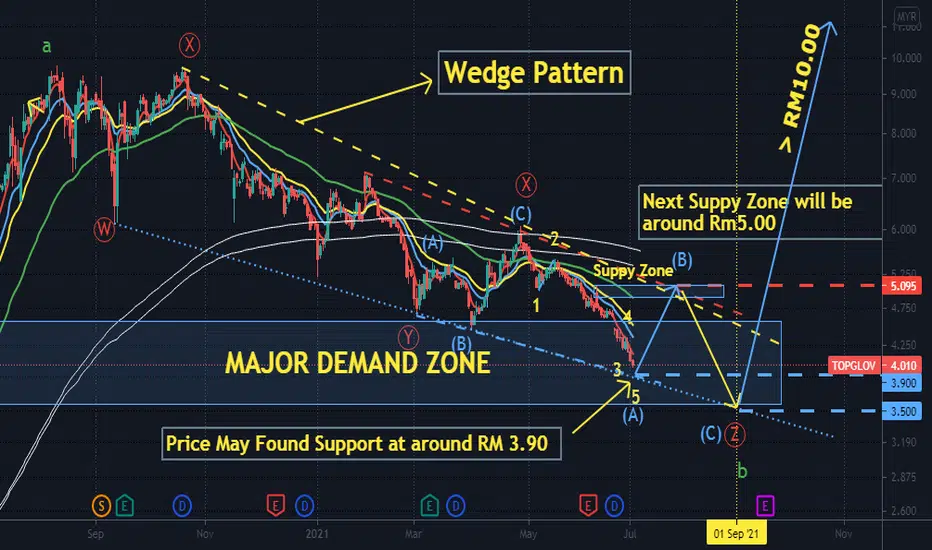
TOPGLOV may found support at ≈3.90. 4 July 21TOPGLOV Price may found its support at around RM3.90 where there will be a lower trend line support of the wedge pattern. Probably the end of wave (A) ( Cyan/ Light Blue )..The Next Major Resistance/ Supply Zone will be around RM 5.00 .
TOPGLOV short term outlook. 1/July/21Top Glove Price may already reached wave (A) (Cyan/Light Blue). Probably its price range much shorter than wave (C)(Cyan/light blue)..Price may resuming its uptrend on Early / Mid July at around RM3.80 after forming wedge pattern

TOPGLOV's Swing Trading Setup. Updated 25/6/21TOPGLOV wave (A)(Cyan/light blue) maybe completed. Wave (B)(Cyan/light Blue) min upward price amount should be = wave 2 (yellow) = Rm0.490 = Target @ RM4.80. S.L @ RM4.310

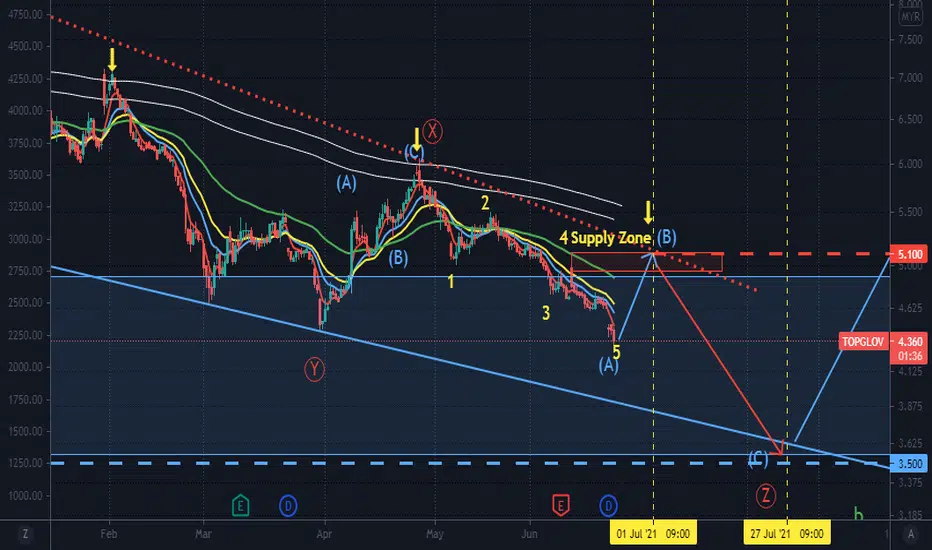
TOPGLOV Might have a pullback toward ≈ 5.10. 24/6/21TOPGLOV might have a pull back toward around RM5.10 where there is a confluence "zone" of 1) Down Trend Line 2)200 EMA line of 4 hours 2) Next Supply Zone.. Before... Resuming its downtrend toward around Rm3.50
TOPGLOV wedge pattern probably not done yet. 20/6/21TOPGLOV price might be forming a wedge pattern which is probably at its last phase of completion also developing as a triple zig zag wave pattern W,X,Y,X,Z( Red Circled ).. the Z wave probably will be reaching at around RM3.50 ( As what JP Morgan Predicted )..which is 1) the lower trend line of the wedge pattern and also 2) the weekly 200 EMA Support line 3)The Next Major Support/Demand Zone


TOPGLOV Scenario 2. Updated 14 June 21If RM 4.45 support broken. The Next Major Support/ demand Zone could be around RM3.50 which is also the weekly 200EMA line..

TOPGLOV Wyckoff Analysis. 9 June 21TOPGlove price have reached its right shoulder at around RM4.75 , and testing Quasimodo level + demand zone
