$DIA // June 17 2025 // CPI Analysis & Targets for Day TradersAMEX:DIA // June 17 2025 // CPI Analysis & Targets for Day Traders
Key stats
About SPDR DJIA US$
Home page
Inception date
Jan 14, 1998
Structure
Open-Ended Fund
Replication method
Physical
Dividend treatment
Distributes
Distribution tax treatment
Qualified dividends
Income tax type
Capital Gains
Max ST capital gains rate
39.60%
Max LT capital gains rate
20.00%
Primary advisor
PDR Services LLC
Distributor
ALPS Distributors, Inc.
Despite the name recognition that comes from tracking the Dow and its own popularity, DIA is not the ideal ETF for investors who want broad-based exposure to US large-caps. The fund's tiny portfolio, arbitrary selection, and antiquated weighting produce significant sector biases relative to the market and cover only a fraction of the large-cap space, typically represented by hundreds of names. Stocks are price-weighted, not cap-weighted, which can produce major sector realignments when multiple holdings change. Still, DIA tends to move with the broader market day-to-day, and some may prefer its typically (slightly) lower beta. DIA is extremely liquid, with huge assets and a long track record. The fund's UIT structure is shared by a few other long-lived ETFs, with the most notable effect being a slight cash drag since dividends received can't be reinvested as is typically the case. UITs must also hold every stock in the index at all times, which can tie the portfolio manager's hands.
Related funds
Classification
What's in the fund
Exposure type
Finance
Technology Services
Electronic Technology
Stock breakdown by region
Top 10 holdings

$DIA // June 10 2025 // Analysis & Targets for Day Traders
DIA sticking to that resistance from last Thursday here ahead of Inflation Data!!

SPY and DIA have reached the ML1 LevelsThe SPY and DIA have reached the ML1 Levels.
Always use stops...
Please Use Caution in Fast Moving Markets - Check Charts for Fast Moves
SYMBOL Trend ML 1 MS 1 IDMM Direction Date
SPY Long 595.12 589.56 LONG 2025-06-03
DIA Long 424.85 421.29 LONG 202

DIA has reached the MS1 LevelThe DIA has reached the MS1 Level at 420.77
This level being reached is a good indication that the short-term intra-day direction is down.

Dow Jones LongsCouple long ideas,
Price action is sitting on big volume note
Sooner or later expect bullish price action
Conservative Position sizing is prudent in this market environment

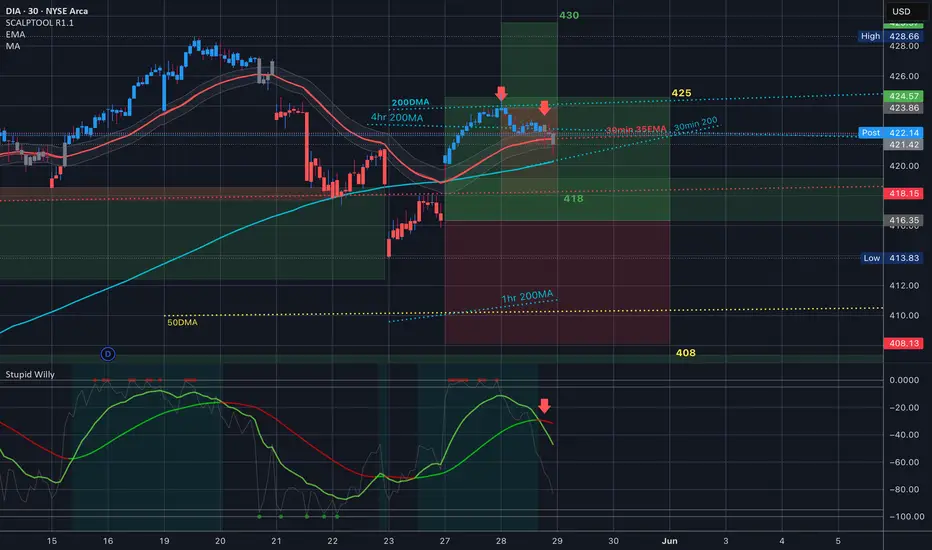
$DIA // May 28 2025 / The Dow rejected at the 200DMA & 4hr 200MAAMEX:DIA The Dow saw some big rejections here today - at the 200DMA and then the 4hr 200MA. The 30min 200 should catch it on the day and then time to look for support. Signal line turned red at 2pm signaling the move lower into close.
$DIA / May 30 2026 CONTRACT / Analysis & Targets for Day Traders
Only the first contract of the week will be public. GL today, y'all...

DIA Continuation PumpGap up and push here?
Stop loss could be at 415 but that would not be with good risk to reward ratio
Use proper position sizing and conservatize risk management
SL 418.47
TP 437.31
$DIA // May 19 2026 // Analysis & Targets for Day TradersAMEX:DIA // May 19 2026 // Analysis & Targets for Day Traders
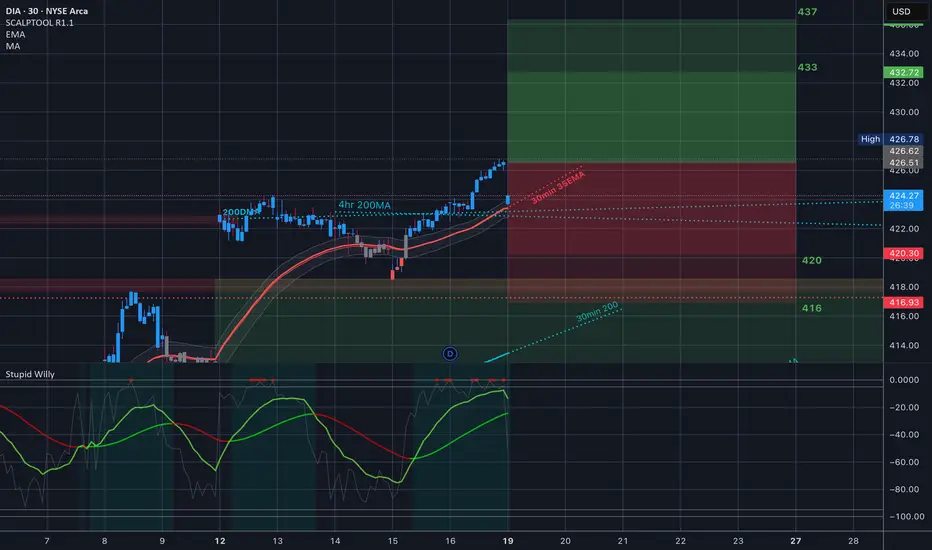
US Downgrade, 3-5-10% Pullbacks But Still Bullish on S&PHappy Sunday!!!
US Futures open lower after Friday's close and Moody's downgrade.
Last time this occurred in 2011, the S&P dropped around 10% from the "news."
This is all interesting timing but I'm still liking pullbacks for opportunities to position
bullish in the US indexes (S&P, Nasdaq, Dow)

See all ideas
Summarizing what the indicators are suggesting.
Oscillators
Neutral
SellBuy
Strong sellStrong buy
Strong sellSellNeutralBuyStrong buy
Oscillators
Neutral
SellBuy
Strong sellStrong buy
Strong sellSellNeutralBuyStrong buy
Summary
Neutral
SellBuy
Strong sellStrong buy
Strong sellSellNeutralBuyStrong buy
Summary
Neutral
SellBuy
Strong sellStrong buy
Strong sellSellNeutralBuyStrong buy
Summary
Neutral
SellBuy
Strong sellStrong buy
Strong sellSellNeutralBuyStrong buy
Moving Averages
Neutral
SellBuy
Strong sellStrong buy
Strong sellSellNeutralBuyStrong buy
Moving Averages
Neutral
SellBuy
Strong sellStrong buy
Strong sellSellNeutralBuyStrong buy
Displays a symbol's price movements over previous years to identify recurring trends.
Frequently Asked Questions
An exchange-traded fund (ETF) is a collection of assets (stocks, bonds, commodities, etc.) that track an underlying index and can be bought on an exchange like individual stocks.
D07 trades at 422.00 USD today, its price has fallen −1.24% in the past 24 hours. Track more dynamics on D07 price chart.
D07 net asset value is 421.93 today — it's fallen 0.81% over the past month. NAV represents the total value of the fund's assets less liabilities and serves as a gauge of the fund's performance.
D07 assets under management is 36.69 B USD. AUM is an important metric as it reflects the fund's size and can serve as a gauge of how successful the fund is in attracting investors, which, in its turn, can influence decision-making.
D07 price has risen by 0.08% over the last month, and its yearly performance shows a 7.81% increase. See more dynamics on D07 price chart.
NAV returns, another gauge of an ETF dynamics, have risen by −0.81% over the last month, have fallen by −0.81% over the last month, showed a 1.01% increase in three-month performance and has increased by 11.20% in a year.
NAV returns, another gauge of an ETF dynamics, have risen by −0.81% over the last month, have fallen by −0.81% over the last month, showed a 1.01% increase in three-month performance and has increased by 11.20% in a year.
D07 fund flows account for 2.73 B USD (1 year). Many traders use this metric to get insight into investors' sentiment and evaluate whether it's time to buy or sell the fund.
Since ETFs work like an individual stock, they can be bought and sold on exchanges (e.g. NASDAQ, NYSE, EURONEXT). As it happens with stocks, you need to select a brokerage to access trading. Explore our list of available brokers to find the one to help execute your strategies. Don't forget to do your research before getting to trading. Explore ETFs metrics in our ETF screener to find a reliable opportunity.
D07 invests in stocks. See more details in our Analysis section.
D07 expense ratio is 0.16%. It's an important metric for helping traders understand the fund's operating costs relative to assets and how expensive it would be to hold the fund.
No, D07 isn't leveraged, meaning it doesn't use borrowings or financial derivatives to magnify the performance of the underlying assets or index it follows.
In some ways, ETFs are safe investments, but in a broader sense, they're not safer than any other asset, so it's crucial to analyze a fund before investing. But if your research gives a vague answer, you can always refer to technical analysis.
Today, D07 technical analysis shows the buy rating and its 1-week rating is neutral. Since market conditions are prone to changes, it's worth looking a bit further into the future — according to the 1-month rating D07 shows the buy signal. See more of D07 technicals for a more comprehensive analysis.
Today, D07 technical analysis shows the buy rating and its 1-week rating is neutral. Since market conditions are prone to changes, it's worth looking a bit further into the future — according to the 1-month rating D07 shows the buy signal. See more of D07 technicals for a more comprehensive analysis.
Yes, D07 pays dividends to its holders with the dividend yield of 1.60%.
D07 trades at a premium (0.96%).
Premium/discount to NAV expresses the difference between the ETF’s price and its NAV value. A positive percentage indicates a premium, meaning the ETF trades at a higher price than the calculated NAV. Conversely, a negative percentage indicates a discount, suggesting the ETF trades at a lower price than NAV.
Premium/discount to NAV expresses the difference between the ETF’s price and its NAV value. A positive percentage indicates a premium, meaning the ETF trades at a higher price than the calculated NAV. Conversely, a negative percentage indicates a discount, suggesting the ETF trades at a lower price than NAV.
D07 shares are issued by State Street Corp.
D07 follows the DJ Industrial Average. ETFs usually track some benchmark seeking to replicate its performance and guide asset selection and objectives.
The fund started trading on Jan 14, 1998.
The fund's management style is passive, meaning it's aiming to replicate the performance of the underlying index by holding assets in the same proportions as the index. The goal is to match the index's returns.