D07 trade ideas

DIA: Aiming higher it would appearThe chart shows a time at mode trend signal that aims considerably higher, but there are hurdles along the way.
It might be interesting to short once the resistances labeled on chart are reached, but only under the highest low.
We can also attempt to capture shorter timeframe legs, up and down, using the 65 minute chart for example.
It's clear that the broad risk on rally theme is back on track, question is for how long will it last?
The uptrend signal expires by November 9.
Let's see how it goes.
If you want live updates and more information, make sure to follow me at collective2, where I provide signals for auto trading and via email for a monthly fee.
I'm also providing access to a live trading chatroom free of charge for concordbay.com customers, contact me via skype for more details.
Cheers,
Ivan Labrie
Time at Mode FX
Analyst at Concord Bay dot com

DIA DOW JONES INDUSTRIAL SPDR - 5Day Time@Mode SetupHere's a simple weekly chart of the DIA using a 5-day chart. 5-Day charts use consecutive 5-day time windows to form the bars and is not a "weekly" chart because it isn't plotting Mon-Fri action as one bar. It's a clever way to group 5-days together for graphing.
The rally up from the 6-week base has now extended 6 weeks and time has expired. The rally has failed to reach the upside target (see white arrows at top of chart) and given that we have had contracting ranges for the last two 5-day time windows which suggests loss of momentum, we can look for sell signals to trigger. We are also rallying into the "High Volume Resistance" on the chart (see labeling on histogram of volume on the right side of the chart).
The bullish points were from before where there was a 6-week range from which a "range expansion rally started from" and then "confirmed by rallying the same distance again within 3 bars", but now the bullish factors are behind the market and it is back to the "prove it" stage once again.
There is one "range expansion from 2 weeks ago that will fail if we don't rally 6.20 points from the 177.68 level. So, we need to reach 183.88 to prove the range expansion from October 22 (week #4 of 6 week rally).
Good fortune to you.
Questions: Please PM me or ask in the "Key Hidden Levels Chat Room" where myself or Ivan Labrie can answer.
Tim

DIA - Fibo Cluster Level Overhead @175-176 BandLooking for potential retracement high to Short the indices, with my main focus on DIA currently.
DIA staged a nice ABC-wave rally recovering from major pivot low of 150.5.
Currently looking ripe for a continuation of the underlying major correction from 183-150.
The 175-176 region is ultra significant, comprising of:
(i) previously surrendered H&S neckline,
(ii) 76.4% fibo retracement line for the 183-150 plunge, & also
(iii) the 127.2% extension level of earlier rise from 155-167.
Similar setups can be found on the other 2 indices - SPY & QQQ.
Will update on SPY over the weekend. :)

Options Expirations in the DIA and support/resistanceThere are a few ideas which will help you decipher where support and resistance are in the market. With the help of TradingView's powerful graphical ability and a subscription to some of the premium services, you can "see" levels of support/resistance in unique ways.
One I am showing you here is "volume profile" which you can set over a time range that you specify. I like to see volume in this way because I want to see volume in the current trend and this provides that for me. When I see a place where very little volume has traded I KNOW that level is important because one side of the market was so strong at that level that it didn't even trade much there. If you rally back up to a level where little volume traded, like the red box marked "LOW VOLUME RESISTANCE", then you can very safely expect a reaction, at least. Some may just call that level a "gap" or a "breakaway level" but I label it "Low Volume Resistance".
I also have plotted the options expirations on this chart, which can often be useful to know about because it is my belief that expirations are the summation of all of the speculators and hedgers "thinking" for that expiration cycle. Everyone closes out their positions or rolls them into the next expiration, but the act of rolling those position and closing positions exerts a force on the market that is useful to reference in future days of trading. Knowing that price gives you information and has you armed and prepared. To NOT know it is to ignore what is going on in the market.
So, I look forward to your comments and questions. And sorry if this looks like an advertisement for TradingView's premium services, but they are valuable and worth it.
Best regards,
Tim
9:47AM EST 9/28/2015

DIA NEUTRALThe DOW from a weekly perspective is
still trading inside its trading range and
looks to retest the FEB lows. watching for
a close below that swing low

DIARounded top on dow shows change in momentum from up to down and this needs to have a healthy correction, odds are it will pop back quicker than the needed 10-12% correction but time will tell

Hillary Clinton Making Tax Proposal Speech INFORMATIONAL:
Hillary Clinton Tax Proposals:
1. Change long term capital gains from 1 year to 6 years.
2. 2-3 years holding period would be taxed at ordinary tax rates instead of <1 year now.
3. Reduce capital gains tax on small business or "innovative" new businesses (Who defines "innovative"?)
4. Change carried-interest tax laws which are unfair.
5. Take a HARD LOOK at stock buybacks. Waiting an entire quarter to report buybacks seems too slow, other countries are "next day".
6. Change corporate executive compensation. Too many high payouts when companies and employees are suffering. Execs make 300 x's what employees make, versus 50 x's in the past.

Dow set for a fallChart shows a vertical line at or around 1 Jul of every year since 1998 (DIA: Dow Industrial Average ETF). More often than not, the Dow falls around this time of the year (unless it has already fallen in the last two months). The faster it has risen in the previous period, the harder the fall tends to be. This year the July fall is likely to be the start of a considerable correction, given that the graph has risen to a spectacular height and that rising interest rates are imminent.


Owner of Grok Trade: DIA at resistanceAs much as I hate "Neutral" ideas, It's warranted here. DIA has slammed into resistance. This trendline has served as resistance two previous times. I expect a stall or a drop going into the weekend.

DIA potential bullish swing Nice gap on 3/20/15 candle. Good volume from the FOMC meeting. Call options May or June should be ok.

DIA bull put spreadSpread is below all the daily moving averages, below a strong support, in the direction of the primary, intermediate and minor trends.

US stock market = a bull marketWhenever the market makes a retracement, it is time to buy. This is the way the stock market has been acting for the last years. 'This is an artificial market', "We will repeat 2008", 'P/E ratios are too high' and all that nonsense pushed this market higher and higher.
Oversold readings of Force Index have made perfect entries in this bull market. The arrows pointing at the volume waves are telling the same story. What should have been bearish changes in behavior, were actually large selling efforts without any gains.
The impulse is green again, and at this point, one should look only at the long side of this market.

DIA day tradeA quick short based on the retest gap. Newsome not trading this one because inside day candle on the daily. Expect a bounce as a swing potentially.

DIA grinding inside purple triangleshort , Feb 15 179Put, BTO 2 contr. @4.1
entered @176.4 STOP 177.13
inside purple triangle
target 174.16

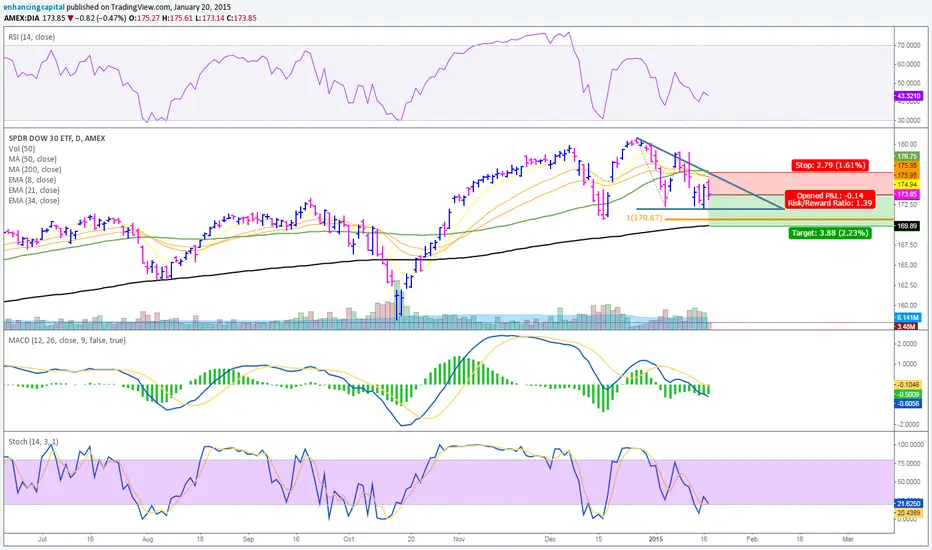
DIA: Descending TriangleA weakened RSI, MACD, and Stocahstic point to a bearish formation on the Diamonds. A first target is the 200 day SMA in black.


Market Index Bearish Divergence (Brad Reed Jan8,2015)Bearish divergence on DIA. Prepare for a market pull back.

DIA watch (Brad Reed Jan6,2015)X marks the spot for DIA. Coming into lots of support and likely to bounce. WAIT for bounce to confirm and verify you have a good reward risk ratio before entering.

DIA - Diamonds could be a traders best friendOnly looking for the bullish swings. Preferably this heads back to the trend line/support line between 170-174. Still bullish until proven otherwise. Most of the notes are on the chart. Oscillators are headed lower from being overbought. RSI is headed lower faster than stochastics and MACD. ADX is headed higher agreeing with the downswing. BB aren't really playing a part right now.
Side note, hopefully the stops your in place on all other trades because yesterday was a long day.
Leave a note below. Comments and critiques ARE welcome and appreciated.
