GLD - Dec & Jan are its bullish seasonality months.If you are a believer of seasonality, then GLD is no longer bearish in the next few weeks.
GSD trade ideas

GLD Current Correction! GLD Current Correction!
GLD is an investment fund that tries to achieve the performance of gold bullion less the expenses of the fund. This fund is currently testing the previous high on September 6, 2011. The fund had a strong bull run since May 28, 2019, and is currently having a correction.
I have indicated the major bullish trendline on the chart of GLD with a linear green line. If the price plunged below the major bullish trendline and below $165.65 then I expect a further correction. Otherwise, currently, I have a short-term price target of $183.69 for GLD. Volume is low right now with the current correction; therefore, I expect GLD to retest the previous price level of $183.69.
Just a humble market opinion by Greenfield Analysis. This is not a recommendation. Greenfield Analysis has no investment in GLD, no plan to initiate a trade in GLD, and does not receive any compensation for this market opinion. Please click Like and follow to see more. Thank you for reading.
Greenfield

Swing trade series post 1, GLD (SPDR Gold Trust)What is GLD?
SPDR Gold Trust is an ETF that follows gold, and an alternative to trading XAU/USD (gold/us dollar).
Technical analysis
As of today, the overall trend is bearish (on the daily timeframe), and there is a strong support (now resistance) above the stock price. The target is the newest support made by GLD when it broke below the current resistance. The stop-loss is just above the current resistance. The entry is right below the resistance.
Other details
This trade can make around 3.8% profit, with a risk of only 1.9% (below the recommended maximum capital risk of 2%). It has a risk to reward ratio of 2, meaning the reward is twice as high as the risk. This is a swing trade and will take around a 1-2 weeks to complete.
Final thoughts
I’ve decided to make a series of swing trade ideas along with educational posts (I’m currently working on one and will make them public every Sunday. Unsurprisingly, they take a lot of time and effort to finish considering the research that needs to be done, so once a week is my timeframe). If you want, you can put in the comments a stock you want analyzed and most likely it will be the subject of the next post (unless there are a lot of suggestions, in which case I will pick one with the best trading opportunities). Good luck and great trading!
*This is not financial advice, although if you agree with my analysis you can always take the trade.


Don't tell Schiff but GLD is bearishGot a signal today on the opening bar of AMEX:GLD spiking out at the 50% retracement of November's price action. This sets up a low risk play back to the bottom and the longer term Retracement level of the 2020 price action around 165.28


GLD LongTouch downtrend channel bottom line
Gap down, open in Demand Zone
Entry 167
Stop 157
Target 193
I am not a PRO trader. I need few months to practice trading strategies.
If you like this idea, please use SIM/Demo account to try it, until my trading plans get high winning rate.

Gold Falling and Looking For Support30k oh my! Today, 11/24, the Dow closed above 30k for the first time and bulls are raging. GLD has broken through a key support level of $174.76 and is back where it was on July 16 at $169.59. Look for resistance here as it approaches the $168.56 resistance target. If it continues falling the $164.95 - $158.09 channel can be played.


GOLD $GLD Establishing a Long PositionIf ever there was a time to try to establish a long position in Gold with an obvious tight stop loss, now is the time.

GLD bearishLooks like its going to ~$160 right now. more bullish above 178 then ~183 and see 5 wave impulse

Bitcoin is going to the high... then what? Look at Gold!It is readily apparent by now that BITFINEX:BTCUSD is on a run for the last ATH. When the price of something is this close to such an obvious level with momentum it is a very high probability bet it is going to reach it and even break it. But what then? You have to BE SMART. A lot of people that don't watch this video are going to FOMO and I pity them but hopefully it comes with a lesson. That lesson they will learn one can already learn by just looking at the chart of AMEX:GLD this year.

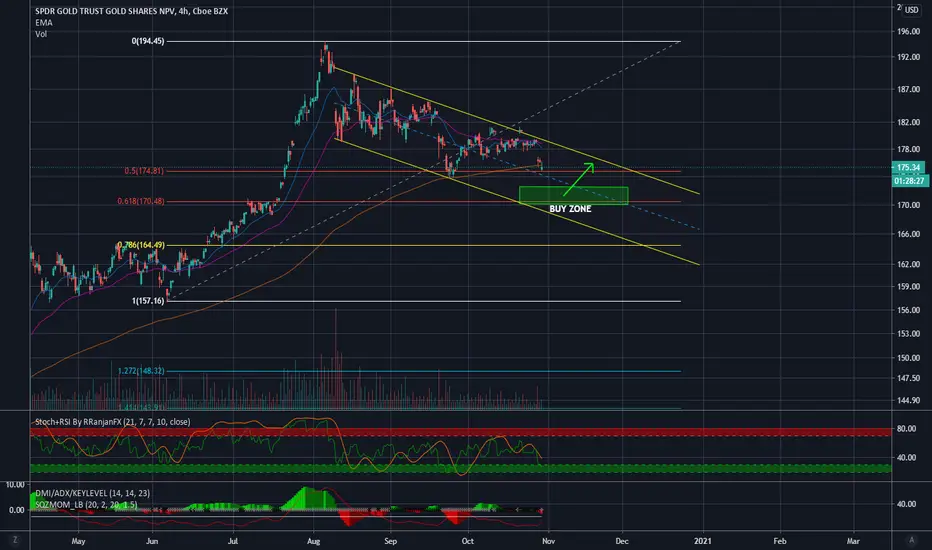
Good buying opportunityMarkets breaking to All time highs except Nasdaq. Not exactly what you want to be seeing.
Gold in the process pulled back to a zone of demand. This zone along with the trend-line from August highs now acting support gives reeason for buyers to come in.
On 4hr candlestick chart, there was a green inside candle after touch the demand zone. On lower time frames showing signs of reversing/bullish.
I expect to ride gold back to 183 and see what happens from there these next couple of days/weeks.


[Long] GLD weekly breakoutPossible trendline / bull flag break on Weekly terms.
Short term / intraday can always see consolidation but it's getting clearer that this weekly consolidation is over or close to over.


GLD - Getting There!GLD is groping for a short term bottom here after getting whacked for $6 over the last week. GLD hit its highs almost three full months ago and is down right at 10% from $195 to $175. RSI on almost every time frame except longer term, 3D, 7D and monthly, looks ready to move higher, however, I wouldn't discount a move lower with all the inviting FIB levels going down to $170 or so. Macro back drop looks very favorable for precious metals and election results should bring a relief rally. Miners were up today despite GLD and SLV being down. Watch this area and support levels closely as it should provide a good entry point for the next leg up!