BABA Yearly Demand Zone Set Up Potential? Over next few months l'll be considering for bullish setup potential with PA down here in and around monthly weekly demand zones. Long term view ahead and thats only if /when sellers become exhausted enough?! , l''ll wait for price structure to tell me what it doing.. & how price builds on multiple time frames perspective while considering and understanding its price dynamics 'PRICE IS KING' then once confirmation presents itself l'll only enter then l'll target above level.
DYOR!! Yes anything can happen, standard disclaimer advice please.
Perma
HBBD trade ideas

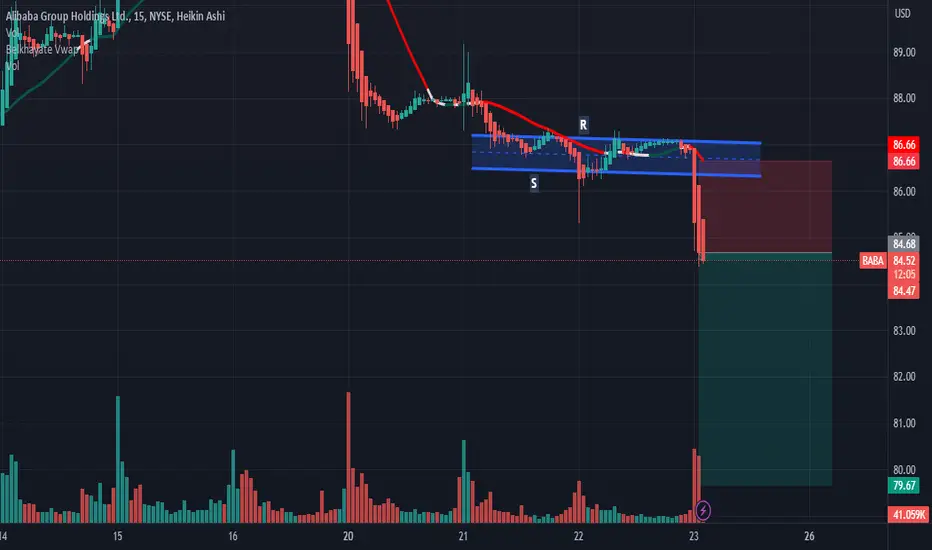
BABA: Sell ideaSell idea on BABA as you see on the chart after the breakout of vwap and support line by the sellers.Thanks!
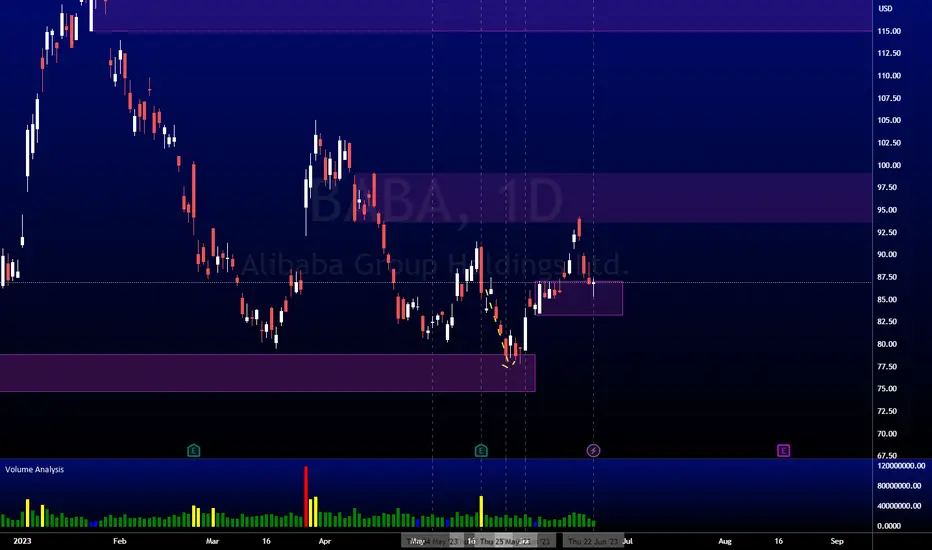
BABA AnalysisPrice playing out nicely as my last analysis. Price mitigated the higher bearish POI at 99.17 and give a nice 9.51% retracement to the downside. Price is currently mitigating the bullish POI at 87.06 and is showing some signs of bullishness, in confluence with a low volume retracement. I'm expecting price to continue higher from here.
Time to enter another swing trade?Selling might bottoming out at around $83. Looking to that range to hop in.

BABA: Sell ideaSell idea on BABA as you see on the chart after the breakout with force the support line by a big red candle.Thanks!

Gimme BABASomeone else has probably published this idea. Wonderful momentum shifting inverse head and shoulders on the weekly, MONSTER weekly bullish bat harmonic price target beyond the measured move of this inverse head and shoulders at a close above 119. Hidden bullish divergence noted on RSI and MACD on this local retest low of the right shoulder. Bullish harmonic confirmation noted on proprietary HSI oscillator on the weekly. Wonderful entry area, easy SL below the head.

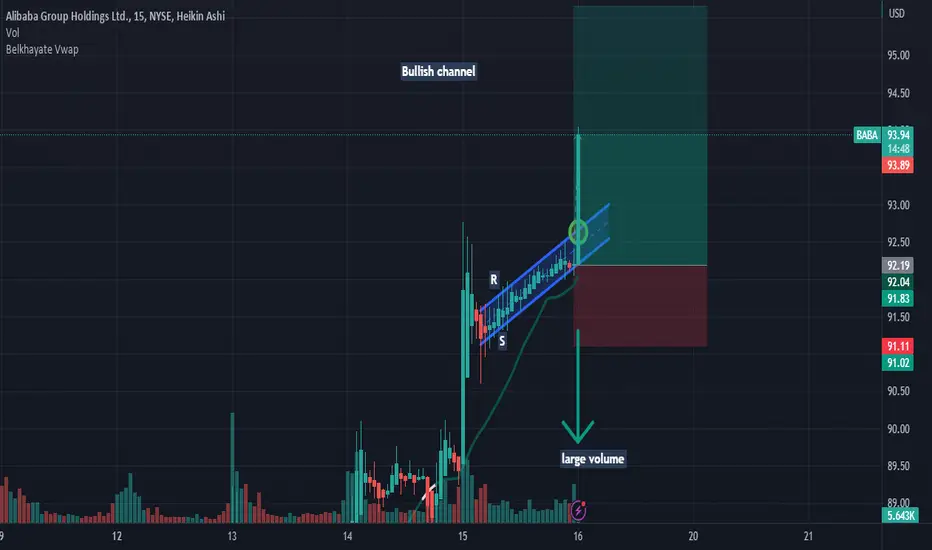
BABA: Buy idea: Bullish ChannelBuy idea on BABA as you see on the chart because we are above the vwap indicator and also we have the breakout with force the resistance line.Thanks!
Baba Short Technically short
Fundamentals long
I short Baba! Cuz fundamentals are manipulated, and news are made by insiders and old.
I keep it simple. But profitable and effective.


BABA buy?BABA broke out of the descending triangle. Now we look for a pullback to bounce off the 10MA. I will not buy until I have that confirmation.

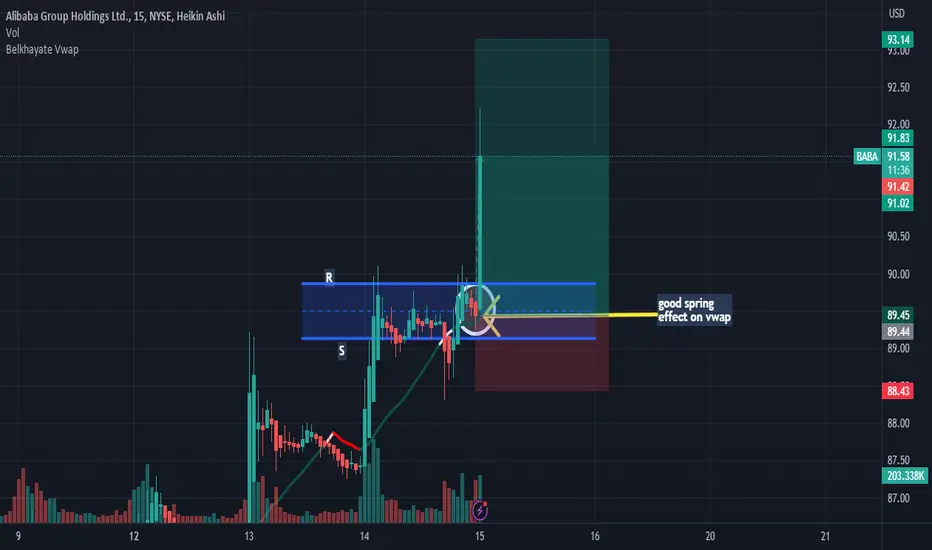
BABA: Buy ideaBuy idea on BABA as you see on the chart because we have a good spring effect on vwap and also we have the breakout with force the resistance line by a big green candle.Thanks!
Part II of BABA thesis using Wyckoff phases and volume analysisThis Idea is part II to the previously published BABA idea using Wyckoff's accumulation method. This idea includes the identification of the different Wyckoff accumulation phases and the characteristic accompanying volume analysis.
All information is on the chart!
NQdecipher

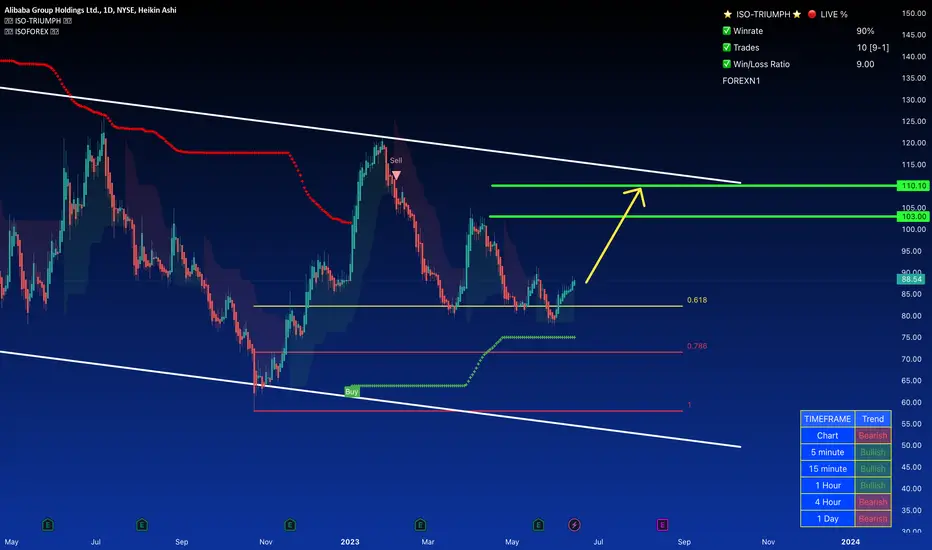
BABA with a Bullish Breakout on the Daily trendBABA has recently confirmed a bullish breakout on the daily trend, indicating a potential continuation of the upward momentum. The formation of a triple bottom pattern further reinforces the bullish outlook. As long as the support level holds, we can expect the price to rally towards the recent highs around $105. Traders should monitor the price action for further confirmation and adjust their strategies accordingly. It's important to stay informed about the latest market conditions and news related to BABA for a well-rounded analysis.

Alibaba:From Promise to Setback and The Potential for ReboundAlibaba, once considered a promising investment tied to China's growth prospects, has faced significant setbacks in the past five years. Despite its declining stock price, the company has continued to expand its business, albeit at a slower pace. However, there are reasons behind Alibaba's decline in appeal, and it's worth exploring the likelihood of a stock rebound in the coming years.
During the past five years, Alibaba achieved impressive growth in annual revenue, with a compound annual growth rate (CAGR) of 28% from fiscal 2018 to 2023. However, recent data indicates a concerning deceleration in growth over the past two years.
This slowdown can be attributed to two primary challenges. Firstly, Alibaba faced setbacks when China's antitrust regulators imposed a historic fine in 2021, leading to tighter restrictions on the e-commerce division. These restrictions weakened Alibaba's competitive position against rivals in the fiercely competitive online retail market.
Secondly, the economic slowdown during the pandemic, along with intermittent lockdowns, had a broad impact on consumer spending across Alibaba's platforms and hindered enterprise spending on its cloud infrastructure services.
To address these challenges, Alibaba made significant strategic moves to streamline its operations. The company restructured its business into six distinct groups, giving each group more autonomy to seek external funding or conduct IPOs. Alibaba plans to spin off its Cloud Intelligence group through an IPO and explore potential IPOs for its logistics and global digital commerce divisions.
These spin-off companies can generate fresh capital, improve overall margins, and expand more rapidly without being closely managed by Alibaba. If successful, they could lead to increased net profits and help alleviate concerns from antitrust regulators.
Looking ahead, the spin-offs initiated by Alibaba have the potential to attract significant investor attention. Alongside this, Alibaba's reported growth is expected to stabilize as the macroeconomic environment improves and its core markets expand. Projections show growth potential in China's e-commerce and cloud computing services markets.
Analysts forecast moderate growth for Alibaba's revenue and net income, driven by continued spin-offs and spending discipline. If Alibaba meets these expectations and maintains a modest growth rate, it could achieve substantial revenue and net income by fiscal 2028.
Considering these factors, even if Alibaba's valuations remain steady, its stock could potentially double in the next few years. However, the emergence of a new bull market and the resolution of delisting concerns could further elevate its valuations. In simple terms, Alibaba's stock could triple or exceed that growth by fiscal 2028.
BABA compresing, will ir be high or low?BABA is presenting a triangle compresing with a breakout aproaching. The direction will be related with economic and fundamental news of China, if it is up I'm waiting a break and retest, if is low I'm waiting for a violent movement.

Long BABA @$78 | Potential Inverse H & S formation at playNo position open yet.
The Fed raised rates by another 25bps the past week and indicated that more rates are still likely to occur in the future.
My long entry point at $78 is to allow the market to breath a bit after the recent rally. China recently eased their covid zero policy and so economic activity should pick up going forward, this is good news for BABA.
Higher Inflation > Higher Interest Rates > Potential Recession ...

Alibaba ($NYSE:BABA) Price Action: Breakout Coming?TL;DR: Alibaba's stock price is approaching a crucial juncture as it encounters resistance at the weekly trendline and finds support near $80. With major indices possibly facing a correction, monitoring Alibaba's price movements is crucial for identifying a potential bullish trade opportunity.
In this trading idea, we analyze Alibaba's ( NYSE:BABA ) price action and its breakout potential. The stock's undervalued fundamentals, coupled with resistance at the weekly trendline and historical support near $80, indicate a possible bullish move. Given the likelihood of a broader market correction, monitoring both market conditions and Alibaba's price movements is key.
Alibaba's undervalued fundamentals, including strong growth projections and solid financials, enhance the attractiveness of a bullish trade. The stock's price action encounters resistance at the weekly trendline, while historical support near $80 acts as a reliable floor. A breakout above the trendline could signal a potential bullish trend.
Considering the possibility of a correction phase for major indices, vigilance in monitoring both the broader market and Alibaba's price movements is crucial. Traders should assess sustained price movements above the resistance level for potential bullish entry signals.
Implementing proper risk management, such as setting a stop-loss order below the historical support level, is essential. Staying informed about market conditions, news events, and company-specific developments is necessary to evaluate the ongoing viability of the trade.
Disclaimer: This trading idea is for informational purposes only and not financial advice. Conduct independent analysis and exercise due diligence before making trading decisions. Trading involves risk, and past performance is not indicative of future results.

I'm Long China Hello folks, NYSE:BABA , NASDAQ:META & NASDAQ:TSLA are almost 90% of my entire portfolio, while I'm flat on first one, I'm up big time on the latter two. thinking to cash out on NASDAQ:META and buy Bitcoin.
What do you suggest ? Shall I keep the portfolio unchanged ? or sell some to buy the digital gold ?
Not a financial advice I can be wrong

BABA TAI see an inverse head and shoulder forming here, and the price is right at a strong support area formed by the first shoulder pattern. The price is also near the VAL on a Daily time frame as shown on the graph below. I believe BABA has strong value and is definitely a strong buy here for long term hold.
@optionsswing

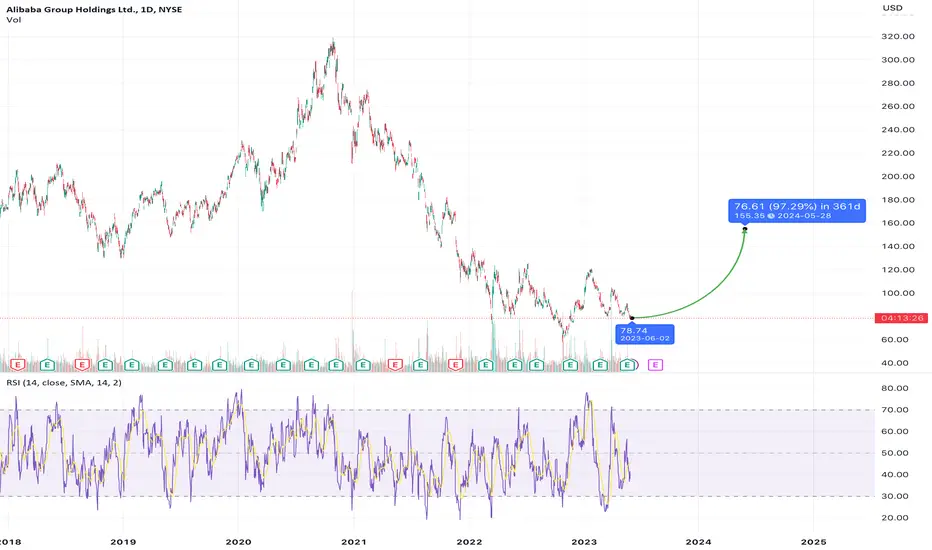
$Baba gives a new chance to enter right now Here is another chance to open a new positions in NYSE:BABA since we are in a strong demand zone and it is going to react with this price zone
Also it is making a Double bottom in this range same as the range in March
and the target for short term is as shown on the chart as well my final target for long
term is in 165 ranges

ALIBABA Stock Chart Fibonacci Analysis 060823 Trading Idea
1) Find a FIBO slingshot
2) Check FIBO 61.80% level
3) Entry Point > 87/61.80%
Chart time frame : B
A) 15 min(1W-3M)
B) 1 hr(3M-6M)
C) 4 hr(6M-1year)
D) 1 day(1-3years)
Stock progress : B
A) Keep rising over 61.80% resistance
B) 61.80% resistance
C) Hit the bottom
D) Hit the top
Stocks rise as they rise from support and fall from resistance. Our goal is to find a low support point and enter. It can be referred to as buying at the pullback point. The pullback point can be found with a Fibonacci extension of 61.80%. This is a step to find entry level. 1) Find a triangle (Fibonacci Speed Fan Line) that connects the high (resistance) and low (support) points of the stock in progress, where it is continuously expressed as a Slingshot, 2) and create a Fibonacci extension level for the first rising wave from the start point of slingshot pattern.
When the current price goes over 61.80% level , that can be a good entry point, especially if the SMA 100 and 200 curves are gathered together at 61.80%, it is a very good entry point.
As a great help, tradingview provide these Fibonacci speed fan lines and extension levels with ease. So if you use the Fibonacci fan line, the extension level, and the SMA 100/200 curve well, you can find an entry point for the stock market. At least you have to enter at this low point to avoid trading failure, and if you are skilled at entering this low point, with fibonacci6180 technique, your reading skill to chart will be greatly improved.
If you want to do day trading, please set the time frame to 5 minutes or 15 minutes, and you will see many of the low point of rising stocks.
If want to prefer long term range trading, you can set the time frame to 1 hr or 1 day.
