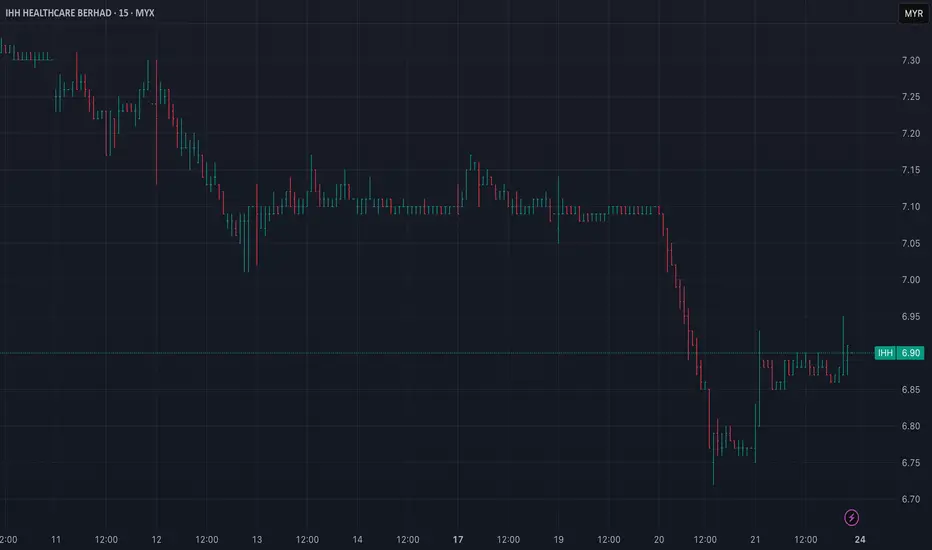
IHH Trading Plan: Simple 2:1 Strategy for Steady GainsIHH Trading Plan
Entry Price (EP): RM6.87
Take Profit (TP): RM7.01 (2% gain)
Stop Loss (SL): RM6.80 (1% loss)
Risk-Reward Ratio: 2:1
Strategy:
Enter at RM6.87 on bullish confirmation (e.g., breakout or strong buying momentum).
Exit at RM7.01 for profit or cut losses at RM6.80.
Risk only 1-2% of total capital for controlled exposure.
Tip: Watch for sector news or earnings updates to support bullish momentum.
Q0F trade ideas

IHH HEALTHCARE BERHAD - BEARISHIHH share price likely to go down to MYR 5.20 ~ long term trend line.
Investors needs to be cautious if the share price breaks the triple top that formed since 2014, it will take tremendous time for price consolidation in bear territory.

IHH IHH - potential break up & turn into up trend
VT Stock indicator is a stock breakout trend indicator for identifying the change of Mid to long term trend direction
(Disclaimer: for demonstrating own planned trade records study only and education purpose, not for recommend to buy or sell. Trade at your own risk)

IHH to build a new base?IHH to open new hospital and has a good track record for its medical college, producing its own medical doctors.


IHH - Pre Consolidation BreakoutNO INVESTMENT ADVICE IS PROVIDED EXCEPT FOR TOOLS DEMONSTRATION PURPOSE.
DISCLAIMER
Please consider your own interpretation of Opportunity & Risk. The author of this post strictly follows the Malaysian Security Commission ( SC ) Guidelines on the prohibition of Investment Advice by unlicensed parties. Any examples shall use historical charts without any recommendations and not to cause inducement to the public to take action or position (e.g. buy, sell or hold) regarding a particular class, sector, or instrument in relation to securities or derivatives. The author will never provide any investment or trading advice as the activity of giving investment advice is likely to be considered as a regulated activity under the Capital Markets and Services Act 2007 ( CMSA ). All posts made in Tradingview do not include any communications involving providing recommendations or opinions or includes any material, content or any statement which are likely to induce a person to take any action or position (e.g. buy, sell or hold) regarding a particular class, sector, or instrument in relation to securities or derivatives that is likely to be considered as “advising others concerning securities or derivatives”. The author will not recklessly make any statement, promise or forecast that is misleading, false or deceptive to induce or attempt to induce another person to deal in securities or derivatives. None of information posted in post can be used as investment decisions. Do not trade solely on the information posted. Trade at your own risk and judgement. A trader could potentially lose all money. Only risk capital that can be lost without jeopardizing ones financial security of lifestyle. Please seek licensed professional guidance if you plan to invest your capital seriously.


IHH (MYX) - Move in RangingGreetings
Humbled, we would like to thanks for your support who has already liked, commented and followed us. Your support, strengthens us, to help in analyzing the market. If you have any questions, do not be hesitant to send us message (inbox). Our Service : Signal recomendation, Trading Course, Portofolio Consultation for multi asset such as Stock, FX, Derivative, Crypto, etc
Strategy
- Please care for Money Management
- Have a good psychology
- Do not be hurry to open position
- Evaluate and upgrade your trading plan
Analysis
IHH (MYX) - Move in Ranging

QOF (SGX) - Potential to ReboundHumbled, we would like to thanks for your support who has already liked, commented and followed us.
Your support, strengthens us, to help in analyzing the market.
QOF (SGX) - Potential to Rebound


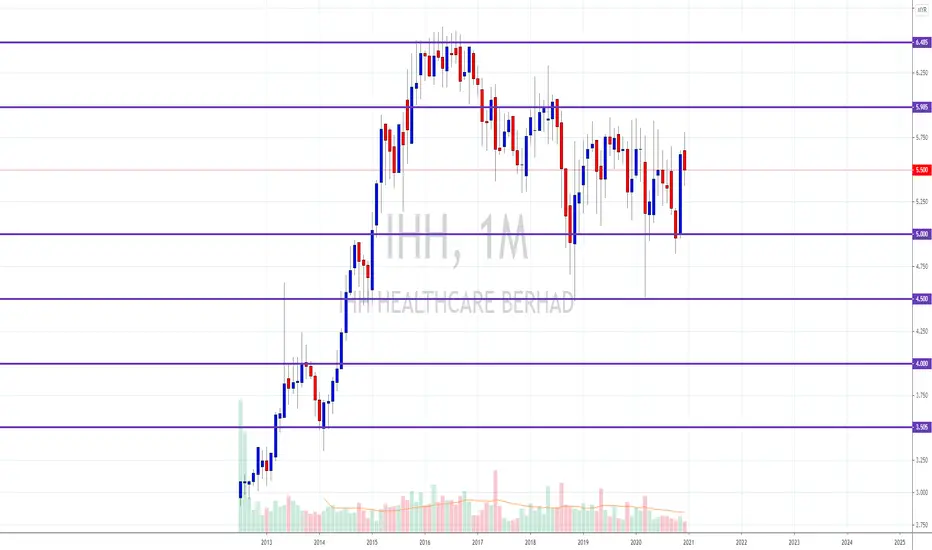
IHH STOCK PICK FROM EXPERT
2021 STOCK PICK FROM EXPERTS
PURPLE LINE = STRONGER SUPPORT
RED LINE = MINOR SUPPORT
Disclaimer:
Please be informed that above analysis are solely for education purpose; it is neither a trading advice nor an invitation to trade. For trading advice, please speak to your remisier or dealer representative.
You are responsible for your own risk management Do Your Own Due Diligence
DAILY ANALYSIS OF IHH HEALHCARE BERHADHi friends
the daily chart of this market shows that it will experience with a high probability a downward trend in the coming days but also we must be vigilant of the change of this market towards the opposite direction
please subscribe to receive new analyzes

IHH - spring setup on breakout retest?HI,
Price had broken out above the horizontal line A at candle 1, and then retraced back to line A but for many days , price failed to close back below line A (now a support line)
At bar 2, price managed to close below line A, but the next day it rallied again and closed above line A. This created a potential spring formation at the bar 2.
As we can see from the downmove that leads to the low at bar 2, the cummulative wave volume was modearately high. Market usually will retest this high volume wave. This happen at bar 3, where there was a widespread down bar but the volume was very llight
The last bar (bar 4) was interesting, its a high volume bar , but it has lower wick and the close was in the middle (Doji candle). If the high volume were from sellers, then price should close more towards the low of the bar instead of in the middle. So in my opinion there was a lot of buyers within this bar. (If you go down to the smaller TF, e.g the 5 mins, u will see the highest volume transaction within bar 4 occured at the 5.29- 5.30 level, which was the lower part of candle 3 and 4. Professional money buy as low as they could, and sell as high as they could)
I'm looking forward for price to rally at least to the recent major top.
Trade at your own risk, this is just me sharing my analysis (and learning journey) using VSA/Wyckoff/Weiss wave methods

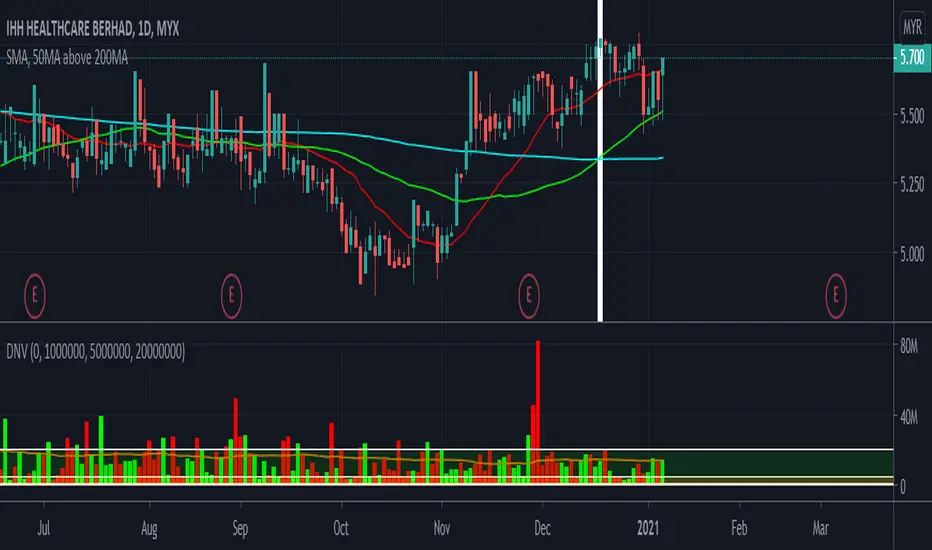
IHH: sedang Trending UPIHH: sedang Trending UP
Melihat pada IHH dengan carta harha hybrid Heikin Hashi, apabila ia sedang bergerak jatuh, lebih banyak lilin merah dan apabila ia naik, lebih banyak lilin hijau. ringkas nya, bila merah jual, bila hijau beli. tapi petunjuk utama membeli dan menjual boleh di gabungkan dengan petujuk petunjuk lain seperti moving average dan ichimoku.
melihat pada moving average pada ketika ini, harga IHH berada di atas garisan moving average 50ma, bermaksud, yang pelabur IHH sedang menunggang saham ini. dan ia di perkukuhkan lagi dengan petunjuk ichimoku. Harga IHH berda di atas awan ichimoku, bermakna IHH sedang bullish. dan paras sasaran IHH adalah pada 5.70 dan 6.10
ini di perkuatkan lagi dengan petunjuk directionall movement index. bila +DI berada di atas -DI, ini menunjukkan yang ia sedang bullish dan pembacaan ADX pada paras 25 mwnunjukkan bahawa trend nya agak kuat dan berkemungkinan akan meningkat.

IHH - Standing Firm in Red SeaLaburlah Technical Coverage (24-MAY, Thursday):
IHH
Technical Analysis Breakdown
1. Trend: Bullish breakout
2. RSI & MACD: Bullish
3. Parabolic SAR: Bullish
4. Resistance level: 6.60
5. Support level: 6.20
Disclaimer: The abovementioned is purely for sharing purpose, you should seek advice from relevant personnel and do your own analysis before making your move.
