Weekly $SPY / $SPX Scenarios for May 12–16, 2025 🔮 Weekly AMEX:SPY / SP:SPX Scenarios for May 12–16, 2025 🔮
🌍 Market-Moving News 🌍
📊 Inflation and Retail Sales Data in Focus
Investors are closely watching this week's release of the Consumer Price Index (CPI) on Tuesday and Retail Sales data on Thursday. These reports will provide insight into inflation trends and consumer spending amid ongoing tariff concerns.
🤝 U.S.-China Trade Talks Resume
High-level trade discussions between the U.S. and China are set to continue this week in Switzerland. The outcome of these talks could significantly impact global markets and investor sentiment.
💼 Key Corporate Earnings Reports
Major companies including Walmart ( NYSE:WMT ), Cisco ( NASDAQ:CSCO ), Applied Materials ( NASDAQ:AMAT ), and Take-Two Interactive ( NASDAQ:TTWO ) are scheduled to report earnings this week. These reports will offer insights into consumer behavior and the tech sector's performance.
🏦 Federal Reserve Speeches
Federal Reserve Chair Jerome Powell is scheduled to speak on Thursday, with other Fed officials also making appearances throughout the week. Their comments will be analyzed for indications of future monetary policy directions.
📊 Key Data Releases 📊
📅 Monday, May 12:
No major economic data scheduled.
📅 Tuesday, May 13:
8:30 AM ET: Consumer Price Index (CPI) for April
📅 Wednesday, May 14:
10:30 AM ET: EIA Crude Oil Inventory Report
📅 Thursday, May 15:
8:30 AM ET: Retail Sales for April
8:30 AM ET: Producer Price Index (PPI) for April
8:30 AM ET: Initial Jobless Claims
9:15 AM ET: Industrial Production and Capacity Utilization
10:00 AM ET: Business Inventories
2:00 PM ET: Federal Reserve Chair Jerome Powell speaks
📅 Friday, May 16:
8:30 AM ET: Housing Starts and Building Permits for April
10:00 AM ET: University of Michigan Consumer Sentiment Index (Preliminary) for May
S&P Global
⚠️ Disclaimer:
This information is for educational and informational purposes only and should not be construed as financial advice. Always consult a licensed financial advisor before making investment decisions.
📌 #trading #stockmarket #economy #news #trendtao #charting #technicalanalysis
S27 trade ideas

SPY My Opinion! SELL!
My dear friends,
Please, find my technical outlook for SPY below:
The price is coiling around a solid key level - 564.32
Bias - Bearish
Technical Indicators: Pivot Points Low anticipates a potential price reversal.
Super trend shows a clear sell, giving a perfect indicators' convergence.
Goal - 539.96
Safe Stop Loss - 577.94
About Used Indicators:
The pivot point itself is simply the average of the high, low and closing prices from the previous trading day.
Disclosure: I am part of Trade Nation's Influencer program and receive a monthly fee for using their TradingView charts in my analysis.
———————————
WISH YOU ALL LUCK

COULD THIS STOCK MARKET BULL CYCLE END BY SEPTEMBER 2025?In this video, we look at AMEX:SPY on the weekly and monthly charts to determine how much longer can this current 2023-2025 bull run can last

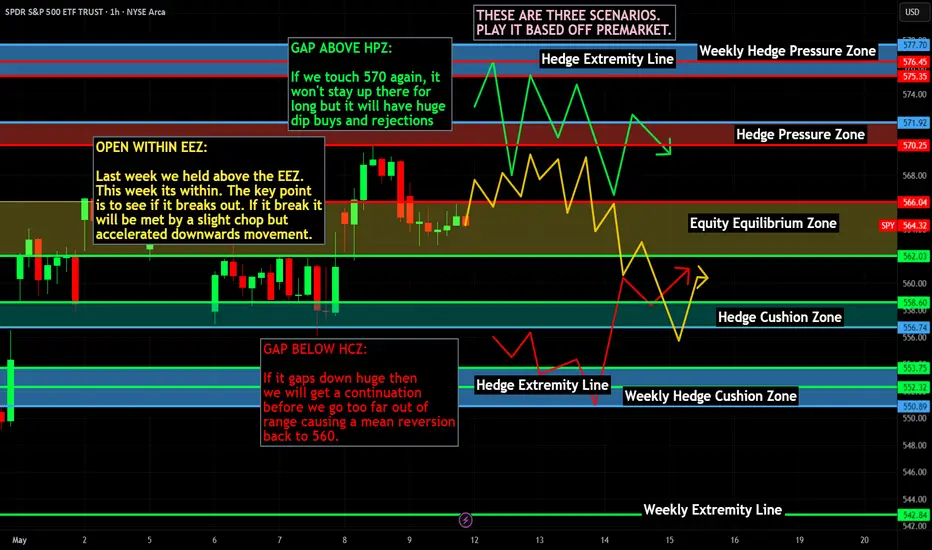
SPY weekly thoughts for May 12th - 16th. Trump Pump?What’s up traders — this is my first idea post here on TradingView, and I’m hyped to finally share something with the community. In this breakdown, I’ll be covering a few key areas I’m watching:
🟩 Support zones
📉 Resistance levels
🕯️ Weekly candle behaviour
🌍 Macro outlook and possible catalysts
📌 Important notes
⚠️ My current bias
Let’s jump in:
🟩 Support Zones:
Buyers are still showing up strong in that $505–$507 range(I highly doubt their orders will get filled lol). it had been a reliable bounce zone — we’ve seen repeated wicks rejecting that level and price snapping back VERY quickly.
Above that, $550 has developed into a new area of support, and right now that’s my main level to watch. If that gives out, I expect we’ll head back down to test the $507 zone again. But for now, bulls are doing their job.
📉 Resistance
SPY keeps getting stuck around $573–$575. That zone’s been tested a few times now, but buyers haven’t been able to push it through. Sellers are stepping in there almost every time.
🕯️ Weekly Candle Context
That’s three straight weekly closes below resistance. Bulls get some momentum mid-week, but by Friday, sellers take over. It’s showing signs of a stall — like the market’s running out of gas near the top.
🌍 Macro Outlook – What Could Move Things
There’s been some talk of softer trade discussions and early negotiations with China. If any of that turns into a real deal, it could be the spark SPY needs to finally break above resistance.
But on the flip side — if Trump starts pushing new tariffs (even smaller ones), those moves tend to hold stocks back, especially in tech.
So the big question is:
Can SPY hit new highs if tech keeps cooling off and there’s pressure from new trade policy?
That’s the tug-of-war right now — possible upside from improving global relations, but real downside risk from political decisions.
📌 Things I’m Watching:
A weekly close above $575 would shift me to a bullish bias.
If we lose $550, I’ll be watching closely to see how price behaves near $507.
⚠️ Current Bias
Right now I’m FAIRLY neutral with a slight bullish lean, but very excited for this next weekly candle.
The macro setup looks like it could support a move higher, but I’m staying decently cautious until we get a clear weekly breakout(+575) and close above resistance.
Let me know what you think — and if you’re watching the same levels.

SPY: Short Signal Explained
SPY
- Classic bearish setup
- Our team expects bearish continuation
SUGGESTED TRADE:
Swing Trade
Short SPY
Entry Point - 564.32
Stop Loss - 575.90
Take Profit - 539.83
Our Risk - 1%
Start protection of your profits from lower levels
Disclosure: I am part of Trade Nation's Influencer program and receive a monthly fee for using their TradingView charts in my analysis.
❤️ Please, support our work with like & comment! ❤️

$SPY AMEX:SPY - Possible inverse H&S forming. Dip into May and, then rally into early July if it plays out.

SPY (S&P500 ETF) - Testing Key Resistance Levels - Weekly ChartSPY (S&P500 ETF) is currently attempting an uptrend rally, bouncing up from the April 7th 2025 support level ($488) and weekly support trendline.
The current resistance price level is $569 above, and the support price level below is $555.
SPY price needs to remain and close above $522 in May 2025 to maintain the current uptrend rally.
Resistance price targets above: $569, $578, $600, $610.
Support price targets below: $555, $542, $533, $512.
Tariff and trade deal news, corporate earnings, government law changes, and consumer sentiment will continue to affect the stock price action of SPY.
Support price levels need to hold for an uptrend to continue in 2025.

BIG Weekend drop coming for SPYMarket reeled in the bulls very nicely this week.
Compression has completed, and a nasty move to the downside is coming early next week.
First target: 555
Second target: 545
Third target: 538

The Best Analysis in the World...You might be shocked by the accuracy of this analysis — so much so that you won’t even know what to do next. Because yes, you could be just one step away from becoming a millionaire... and missing that moment is painful.
But don’t worry — I’m here, and I won’t let that happen.
This legendary setup is called The Golden Lizard, and trust me, it’s not here to play games. Don’t underestimate it. Please, stay calm... and don’t faint. 💥🦎💰

Spy $550 This WeekUpdated SPY Weekly Forecast Range (as of $563)
Scenario Projected Close Range Probability
Bull Case $570 – $577 40%
Base Case $558 – $566 45%
Bear Case $545 – $555 15%
🔼 Bull Case Summary ($570–$577)
Conditions:
CPI data comes in cool (Thursday)
PLTR, AMD, DIS all beat and guide higher
Fed speakers lean dovish
Mega caps like NVDA & MSFT fuel rotation higher
SPY clears the psychological $565 resistance
Fuel:
Short gamma squeeze above $565
Call wall shift to $570/$575
Sector momentum in tech, financials, and discretionary
⚖️ Base Case Summary ($558–$566)
Conditions:
CPI is in-line
Earnings are mixed (1 or 2 misses)
Market digests prior rally, stays elevated
No breakout — just holding range
Behavior:
SPY consolidates around 8-day EMA and VWAP
Buyers hesitate near $565–$567
Light-volume pullbacks to $560 or $558 get bought
🔻 Bear Case Summary ($545–$555)
Conditions:
CPI comes in hot → rate cut expectations fall
Key earnings disappoint (PLTR, AMD, DIS miss or lower guide)
Yields spike, market pulls back fast
SPY loses 8-day EMA, dips toward 21-day EMA near $548
Fuel:
IV spike → volatility unwind
Bond market pressure → liquidity stress
Rotation into defensive sectors (XLU, XLP)
🔍 Supporting Indicators (Real-Time Drivers to Watch):
CPI – Thursday, May 9
10-Year Yield reaction post-CPI
Earnings releases (especially PLTR Monday + AMD Tuesday)
Options flow around $565, $570 strikes
Volatility Index (VIX): Holding under 14 = bullish, over 15 = caution

$SPY Its time according to my chart.. Lower high is the trigger I posted two charts for reference to the current situation. With a historic rally right into resistance and a fractal analog that matches, I have no choice but to remain bearish. These are my studies. Sometimes Impatience leads to things like Impulsive Entries and Exits, Revenge Trading, and at times, even Blown Accounts. Times like those should be followed by a regroup and a reset.
The 9 Count Sell Signal Triggered with a Reset is on Technical Inidators for a move lower. I do believe we are going to consolidate for several days but nothing further than the second week of May. Today Bulls got extremely bullish and still were not able to hold the highs into the close. The test of the 200 day SMA was rejected and several days near these leveles whether above or below, would prove the downside move more possible. The monthly on SPX is my biggest indicator, personally. If it follows the pattern I'm following then after a test of the 10WMA, we will roll back over on the next 10 day candle. The market ran through a death cross without stopping, which if anyone were to study for several minutes, they would be able to see any first attempt at a death cross to the upsde is almost immediately met with a selloff back to the lows of the breakout move. Good luck everybody.

Nightly $SPY / $SPX Scenarios for May 9, 2025 🔮 Nightly AMEX:SPY / SP:SPX Scenarios for May 9, 2025 🔮
🌍 Market-Moving News 🌍
🚢 Maersk Adjusts Outlook Amid U.S.-China Trade Tensions
Global shipping giant Maersk reported better-than-expected Q1 profits but lowered its forecast for global container volume growth, citing uncertainties from the ongoing U.S.-China trade war. CEO Vincent Clerc highlighted that while U.S.-China shipping volumes have declined, the rest of the world remains stable.
🇺🇸 Fed Officials to Speak Post-Meeting
Following the Federal Reserve's decision to maintain interest rates, eight Fed officials are scheduled to make public appearances today. Investors will be keenly observing their remarks for insights into future monetary policy directions.
📈 Markets React to Trade Developments
U.S. markets closed higher yesterday, with the Dow gaining 250 points, as investors responded to President Trump's encouragement to 'buy stocks now' amidst ongoing trade negotiations.
🛠️ U.S.-U.K. Trade Deal Finalized
The U.S. and the U.K. have agreed on a trade deal involving reduced tariffs and adjustments to digital services taxes. This development is expected to influence sectors ranging from automotive to digital services.
📊 Key Data Releases 📊
📅 Friday, May 9:
3:00 PM ET: Consumer Credit (March)
⚠️ Disclaimer:
This information is for educational and informational purposes only and should not be construed as financial advice. Always consult a licensed financial advisor before making investment decisions.
📌 #trading #stockmarket #economy #news #trendtao #charting #technicalanalysis

SPY/QQQ Plan Your Trade Update : Finding Confirmation & MoreThis video will become the start of more advanced training videos to help all of you understand how to use your own skills/tools/resources to try to find the best opportunities.
As I state in the video, I will never tell you what to trade. EVER!
It is unethical and illegal. I'm not a broker or financial advisor.
I'm a software developer/trader and I like to try to unlock the secrets of the markets using price action and inference models (and more).
This video teaches you how to use my CRASH INDEX and the SuperTrend indicator as a way to develop better allocation and risk protection skills for your own trading.
Let's face it - trading is about developing a process to consistently GET PROFITS. It doesn't really matter if they are 10%, 20%, 30% or more. If you are able to consistently execute good trades and PULL PROFITS - you will grow your account- right?
So stop swinging for the fences. Learn to develop skills that keep you on the right side of these big trends.
It's not that hard.
In this video I try to teach you to use Daily, Weekly, 240 min, 120 min, 60 min, 10 min, and 5 min data using my Crash Index to help you learn to trade the SPY/QQQ.
The Crash Index is suited for the SPY/QQQ in most cases. There are instances where the Crash Index may reflect some type of counter-trend - so remember to use Fibonacci Price Theory on the underlying symbol (SPY or QQQ) as final confirmation.
And, remember to try to understand primary trending (longer-term trending) vs. short-term trending. If you are going to try to trade a "counter-trend" swing - cut your trade allocation down by 50-60% (or more). Counter-trend swings are usually going against the major/primary trend.
Anyway, watch this video once or twice. I hope it helps all of you understand and build your own skills to trade more efficiently.
The trick is to get it down to a process where you know how to allocate your capital and you know how to confirm/invalidate trade setups/triggers.
Once you get to that point - you turn into a trading machine. The only step of the process that is really difficult to handle/manage is the BOOK IT phase. If you book your profits early - you may feel bad about leaving profits out there you could have had. But, a PROFIT is a PROFIT.
And the goal of trading it to PROFIT more than you LOSE - right?
Get some.
#trading #research #investing #tradingalgos #tradingsignals #cycles #fibonacci #elliotwave #modelingsystems #stocks #bitcoin #btcusd #cryptos #spy #gold #nq #investing #trading #spytrading #spymarket #tradingmarket #stockmarket #silver

Beyond The Plan Your Trade Videos - Trading Algos/ConfirmationMany of you follow my morning Plan Your Trade videos - and I thank you for your loyalty and dedication.
The Plan Your Trade videos are specifically deigned to highlight my SPY/GOLD Cycle Patterns and, over the course of the past 9+ months, I've started trying to teach all of you Fibonacci Price Theory and the concept of the Excess Phase Peak pattern (and Cradle Pattern).
My goal is to teach you to learn to understand price structures, setups, and actions as a way to try to advance your technical analysis/trading skills.
There are so many others out there trying to teach you to use indicators and other types of analysis to try to identify trading opportunities/setups. Some work, some don't.
Technical analysis using Indicators, Elliot Wave, or other forms of predictive analysis/AI are only about 50-75% accurate at best (IMO). Nothing is 100% perfect.
After 35+ years of trying to unlock the secrets of price action to devise a 100% accurate trading system, the closest I have come is a system that generates about 65-75% accuracy - but still manages to take some losses.
I do believe I can find that 100% accurate system (hopefully before I die). But the reality is it is almost impossible to accurately predict price movement 10-20+ days in advance with any degree of accuracy.
Over the past few weeks/months, we've seen the SPY/QQQ move through various stages/phases.
Over the past 4+ weeks I've been warning of the broad-consolidation phase that is currently setup on the SPY/QQQ. I believe this huge consolidation range is very dangerous for traders and that extreme volatility will create lots of risk/opportunities for those capable of trading within this range.
But, at the same time, failing to take advantage of tools to help traders hedge, daytrade, or otherwise balance allocation/risk levels is something I really don't talk about much.
I like to say "I do the research - you make all the trading decisions".
This video highlights some of my advanced algos and how I use them, in conjunction with the EPP and other patterns, to try to gauge market opportunities vs. risks.
Trust me. I've learned not to GO BIG on trades over the past 20+ years because I've blown up a few accounts trying to get greedy.
Right now, I focus on trying to be on the right side of trends (if possible) and to balance my portfolio in 10-20% increments.
For example, if I believe GOLD is going to move higher, I may start out with a 5-10% allocation into GLD or UGL (start small). If that trade works and Gold starts to make a move higher, I may try to add a bit more to that initial trade. If it doesn't work out, I may try to add a little bit more at a better entry price level - but I focus on not letting that trade occupy more than 15-20% of my total portfolio.
That way, if I take a loss on the trade, it is a small loss compared to the overall account capital.
If I take a 50% loss on a 20% allocation - that is only a 10% loss on the TOTAL ACCOUNT SIZE.
Get it?
So, the reason for this video is to show you how you can still use technical strategies/indicators to try to confirm you intraday trading and swing trading opportunities. I like to use the SuperTrend strategy on charts to identify general trending.
I'm urging you to consider my Plan Your Trade videos as "one component" of your skillset. You need to use your own skills/techniques/analysis to try to manage risks vs. opportunities as you continue to trade.
I highlight some of my algos because they become another "component" of my analysis when I'm trading. If I don't see broad market capitulation related to Daily trending - then I try to stay VERY CAUTIOUS. If I do see some capitulation within my algos suggesting the markets are starting to trend upward or downward, then I may try to take advantage of that opportunity.
Ideally, the process of trading is to use everything you like and can rely on to help confirm you decision-making. Then, fall back to a efficient trade allocation process that attempts to limit your risk level.
The biggest mistake I see people make is to go ALL IN or TOO HEAVY into a trade thinking they can't lose. Yes, you can lose. So can I.
That's why it is important to contain risks and protect capital at all times.
I'll try to create another video showing you how I use the SuperTrend indicator to help confirm some of my intraday analysis for trades.
Get Some.
#trading #research #investing #tradingalgos #tradingsignals #cycles #fibonacci #elliotwave #modelingsystems #stocks #bitcoin #btcusd #cryptos #spy #gold #nq #investing #trading #spytrading #spymarket #tradingmarket #stockmarket #silver

The Daily 200 MA Is The KeyRegarding how price action will play out over these next couple months, there's 3 likely scenarios, and it involves how price will interaction with the daily 200 MA:
BLUE: Price makes a convincing break above the daily 200 MA, retests it, and then surges onward, continuing the long-term bullish trend.
PURPLE: Price falsely breaks above the daily 200 MA and tests the 600 psychological level, rejects it, and falls back below the daily 200 MA and retests it, thus creating a H&S pattern and confirming the continuation of the bearish trend.
RED: Price rejects the daily 200 MA, and continues the bearish trend, ultimately forming a new low.

SPY/QQQ Plan Your Trade For 5-8 : EPP & Cradle Pattern UpdateThis video highlights why I continue to stay very cautious of this upward price move in the US markets.
It also highlights that the current trend is BULLISH - not BEARISH. When I post the videos in the morning, I've been selecting BEARISH as the general trend because I believe the markets are going to roll over into a breakdown phase. Until that happens, though, the markets are in a BULLISH price trend - attempting to possibly break above the current Ultimate High.
This is more of an instructional video - trying to show you why I continue to urge caution related to trends and why I belive we may have many months to go before the US markets really start to make a bigger "exit trend" type of move (exiting this broad consolidation range).
The other thing this video should teach you is how to identify EPP and Cradle patterns more efficiently and how to use them.
Ultimately, everything I share with all of you is designed to help you understand price as the ultimate indicator.
If you can grasp these concepts and understand how each phase of price structure presents opportunities, then you should be able to time and execute your trades very efficiently.
As I've stated in the videos, because of family medical issues over the past 60+ days, I've moved away from daytrading and gone back to a 2-5+ week swing trading style.
Simply put, I'm driving all over the place taking care of my family, seeing doctors, and other stuff - so I can't stare at my PC/Phone while the markets are open.
I'm also taking very low risk trades. If I decide to get into a trade, I'm usually avoiding the SPY/QQQ and selecting some SPDR sector (or other ETF) that allows me to play the move I expect without risking a fortune doing it.
Anyway, I hope you enjoy this video. I'll probably create one more after this video posts.
Get some.
#trading #research #investing #tradingalgos #tradingsignals #cycles #fibonacci #elliotwave #modelingsystems #stocks #bitcoin #btcusd #cryptos #spy #gold #nq #investing #trading #spytrading #spymarket #tradingmarket #stockmarket #silver

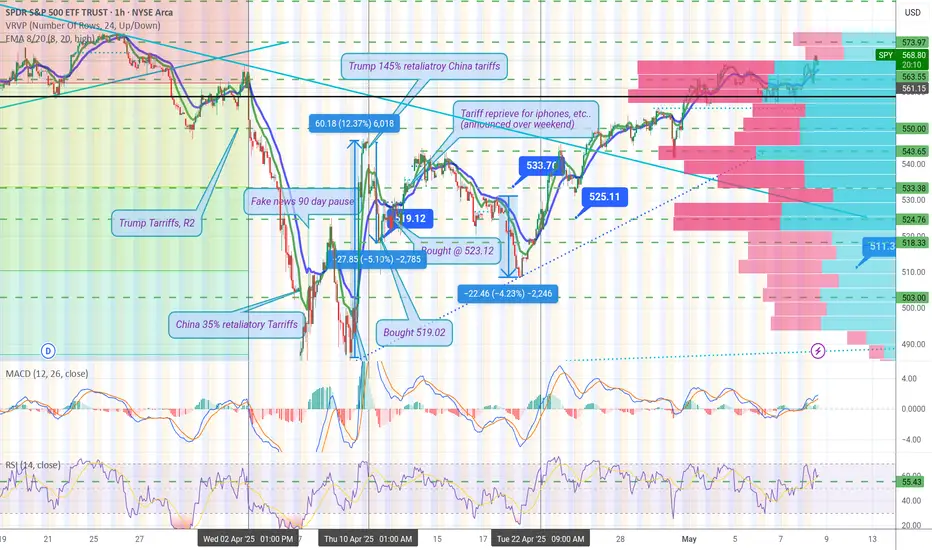
End of the Chaos?April was pure mayhem, and i feel like I barely made it out alive...but with the UK-US trade deal being hailed as a victory for both sides, maybe there's a light at the end of the tunnel?
But we are only 60 days away from the end of the tariff reprieve (to be reinstated on June 9th)... Maybe he'll change his mind by then? Or maybe the EU trade deal set for this weekend will also go well? Spurring further trade deals?
Open to constructive comments on how to deal with the current market situation, which seems to be completely dependent on what the guy in the white house does/says/tweets on any given day...
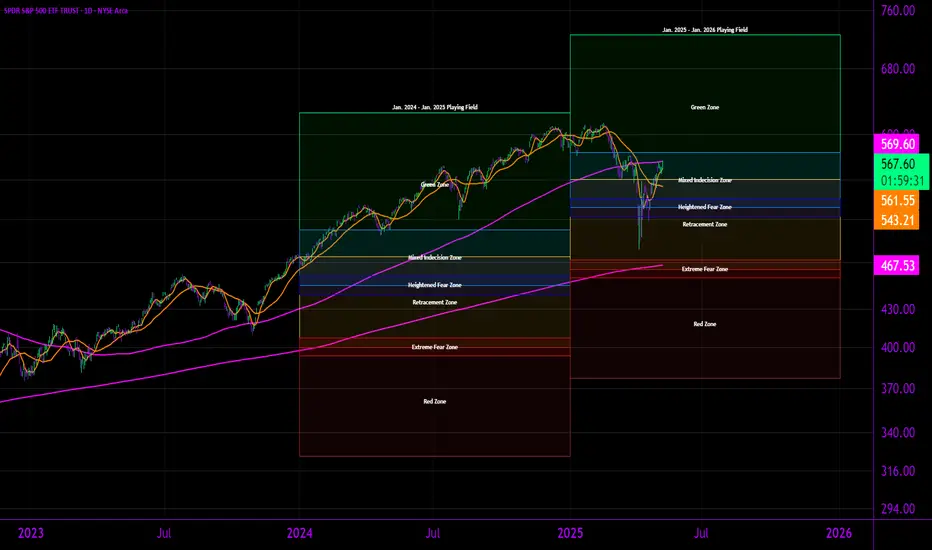
$SPY Yearly Update. Let us just observe.
I hope we reach targets between 725/1000 by 2028.
Meanwhile you can really gauge your buying/selling targets with this little tool I made.
It just gives my perspective (original) on sentiment at price levels. Valuation is different a little bit.
Still. We can observe and potentially participate.
I will do a yearly update on AMEX:SPY once per year from now on.
Enjoy,
Mr. Storm
$SPY / $QQQ – Bull Flag Breakout in Progress?📈 Both AMEX:SPY and NASDAQ:QQQ just broke out of bull flag patterns after a strong recovery from the April lows.
🔍 Technical setup:
Flags formed after a vertical rally ✅
Breakout candles with follow-through ✅
Still riding key EMAs (20/50) with decent volume ✅
📌 Targets based on flagpole projection:
AMEX:SPY → ~582–590
NASDAQ:QQQ → ~505–510
However… mind the context:
We’re heading into macro risk events, and positioning is getting crowded.
These breakouts need confirmation via volume + higher high closes.

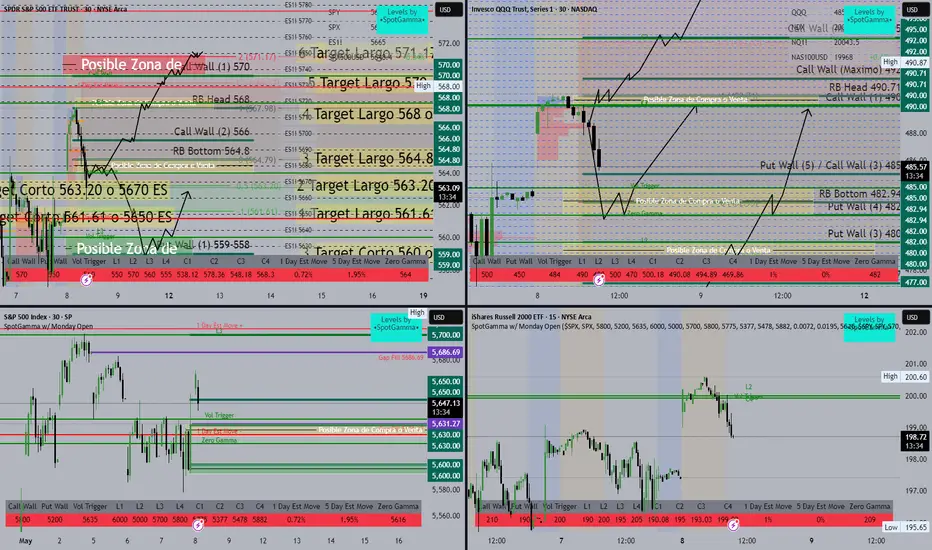
SPY/QQQ 8 de Mayo 2025SPY/ES Liquidity & Target Zones - Market Plan Overview
This visual map integrates liquidity levels, volume walls, and SpotGamma data to forecast key trading zones. Let's break it down in a structured format for better clarity and decision-making:
🔴 Possible Sell Zone / Final Target
Zone: Around 571.17 SPY or 5750 ES
Label: "Possible Sell or Final Target Zone"
Confluence: Call Wall (+1) at 579, significant resistance
🧠 This is a key exhaustion point for long positions. Ideal area to take profit or consider shorts.
✅ Upside Targets (Long Bias)
Target # SPY Level ES Equivalent Notes
6 571.17 5750 ES Extreme resistance zone
5 570 5740 ES Above Call Wall
4 568 5720 ES Matches liquidity cluster
3 564.8 5685 ES Near RB Bottom
2 563.20 5670 ES Mid-range pullback
1 561.61 5650 ES Close to mid gamma
🧠 These levels can be used for trailing targets or re-entries on pullbacks.
🔻 Downside Targets (Short Bias)
Target # SPY Level ES Equivalent Notes
1 563.20 5670 ES First major support
2 561.61 5650 ES Mid gamma support
3 560 5635 ES Near Zero Gamma and Put Wall
🧠 Breaks below these can trigger accelerated downside moves.
📈 Key Zones
Green Zone (Buy Zone):
559–558 SPY — Strong Put Wall and bounce probability area.
Yellow Zone (Flip Zone):
Around 564.79 SPY — Possible area of reversal, watch for reactions here.
Red Zone (Sell Zone):
Above 570 SPY — Watch for overextension and reversal signs.
🔍 Technical Tools Used
Call/Put Walls: Indicate dealer hedging areas and potential price magnets.
Volume Profile: Highlights high-activity price zones.
SpotGamma Levels: Used to identify gamma flip zones, walls, and trigger areas.
🔁 Possible Scenarios
Bullish Path:
Bounce from 561–563 range → Reclaim 564.8 → Push towards 568, possibly 570+.
Bearish Path:
Rejection at 564.8 or 568 → Breakdown below 561 → Test Put Wall at 559.
SPY/QQQ Plan Your Trade For 5-8 : Carryover PatternToday's Pattern is a Carryover pattern in Carryover mode.
After yesterday's FOMC news (unchanged), the markets are seeking a bit of direction. Bitcoin rallied and INVALIDATED a EPP Flagging pattern. In my opinion this suggests the SPY/QQQ may attempt to move a bit higher after the Fed decision.
Although, I still believe the global markets are reacting to uncertainty and tariff news within a very broad consolidation range. So, I'm cautious of trying to go ALL-IN on any long trades at the moment.
Until we break clear of the consolidation range, price could break strongly to the downside on news or geopolitical content. In reality, any type of big news could prompt a downward price move within an uptrend or a consolidation range.
It just seems as though the current global market environment is fraught with uncertainty - so I continue to stay cautious.
Gold and Silver pulled downward overnight. But I still believe metals will continue to rally - attempting to hedge against global risks.
With Bitcoin rallying a bit higher (still in consolidation) - let's see how the next few days play out.
I would be surprised if BTCUSD and the SPY rallied to new highs before the end of May. VERY SURPRISED given the status of the global markets.
But, the markets can stay completely irrational much longer than I can try to fight them. So we have to move WITH the markets - not against them.
Get some.
#trading #research #investing #tradingalgos #tradingsignals #cycles #fibonacci #elliotwave #modelingsystems #stocks #bitcoin #btcusd #cryptos #spy #gold #nq #investing #trading #spytrading #spymarket #tradingmarket #stockmarket #silver

SPY RESISTANCE AREASPY is currently approaching the resistance zone between 560–580.
The gap zone at ~560 is acting as a key support.
If the price holds above this gap, the next target is set at 610.
Failure to hold may push the price down toward the strong support zone between 530–540.
#SPY #Trading #StockMarket #VolumeProfile #TechnicalAnalysis #Earnings #Investing #WallStreet
#globaltrade #investment #investing #stockmarket #wealth #realestate #markets #economy #finance #money #forex #trading #price #business #currency #blockchain #crypto #cryptocurrency #airdrop #btc #ethereum #ico #altcoin #cryptonews #Bitcoin #ipo
